Here's some charts of the Eur and Gbp, the only ones I watch. I think pictures will help explain it better than I can, for now. Keep in mind, this is just an alternative to whatever anyone is now doing. I do question the use of Fibs drawn on the CZ...it's just not the way I understand how they work, but if it works, then so be it.
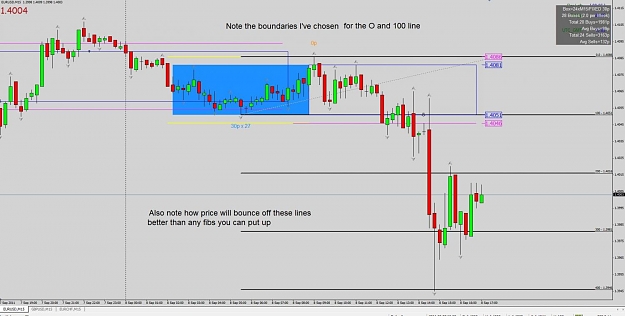
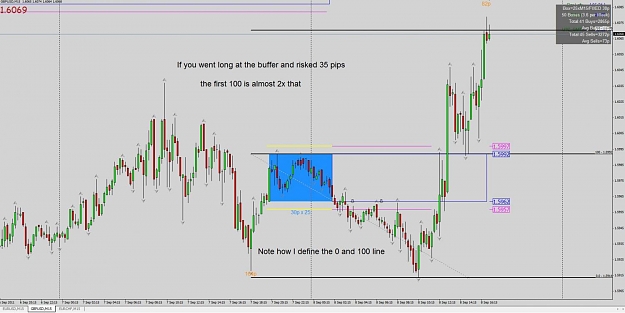
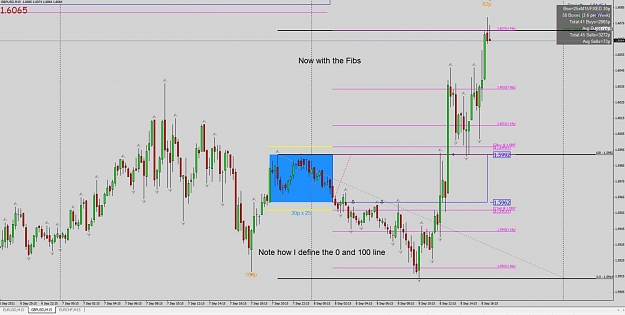
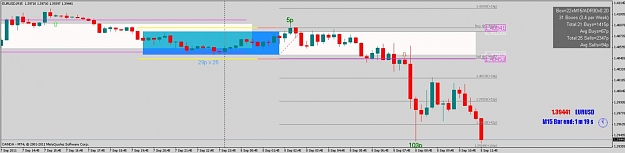
As I mentioned earlier, these are called Measured Moves, as Alan Andrews called them many years ago. Again, I don't pay attention to the number of times the boundaries are hit, I'm only interested in the range itself. I use Fractals to simplify finding the highs and lows.
First up is today's Eur.
As I mentioned earlier, these are called Measured Moves, as Alan Andrews called them many years ago. Again, I don't pay attention to the number of times the boundaries are hit, I'm only interested in the range itself. I use Fractals to simplify finding the highs and lows.
First up is today's Eur.
Attached Image(s) (click to enlarge)