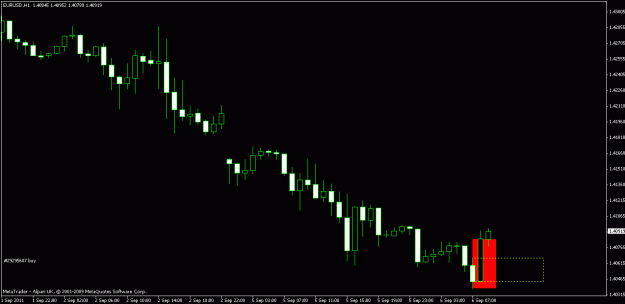
Wow...last hour's high gets the...about face. What about the previous hour? You have the three candles highlighted. Any significance of it, or is it just that pain in the arse elliptical tool in MT4?
Wow...last hour's high gets the...about face. What about the previous hour? You have the three candles highlighted. Any significance of it, or is it just that pain in the arse elliptical tool in MT4?
Ignored
Don't know about that, but I think we'll be going up from here. But that's just me, maybe. As I said, I'll be only looking for longs today.
Wow...last hour's high gets the...about face. What about the previous hour? You have the three candles highlighted. Any significance of it, or is it just that pain in the arse elliptical tool in MT4?
Ignored
it's a two bar/candle pattern... though i guess 2 previous down bars doesn't matter much... just the reaction off the lows above the previous bar is the action at the right spots.
Don't know about that, but I think we'll be going up from here. But that's just me, maybe. As I said, I'll be only looking for longs today.
Ignored
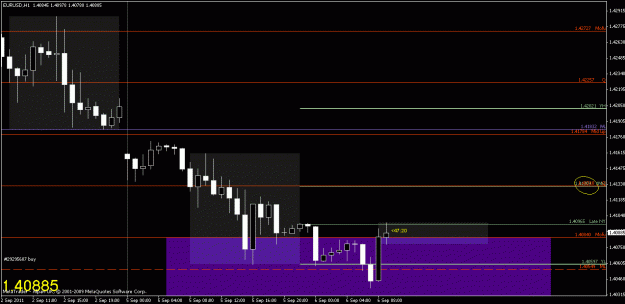
Well 500 ticks non stop no retrace move down looks more than healthy to take profits and take a breather at least.... All TF below weekly are clean in my chart and only monthly chart is in play at the current levels. I only have 1.400x below and if broken (is weekly range since April) a clean, "easy" and fast ride to 1.389x.
To the long side, only the last breakout points tradable starting with 1.414x and after 1.422x. Above daily is clean air to back to the top of the range 1.451x....
For today intraday, Monthly / daily rejection of lows is in play (good setup) at last daily S (1.409x) and looking for Gold to 1980 on more bad reports...
GL
sisse
Pending conversations? PM for a chat...I am mainly in OTM now
No idea what they'll pull out of the hat next. Heard they may put in some sort of "cap" against the EUR. I have a couple pending orders placed...many above where we're at, in case they intervene. Same with YEN.
Well 500 ticks non stop no retrace move down looks more than healthy to take profits and take a breather at least.... All TF below weekly are clean in my chart and only monthly chart is in play at the current levels. I only have 1.400x below and if broken (is weekly range since April) a clean, "easy" and fast ride to 1.389x.
To the long side, only the last breakout points tradable starting with 1.414x and after 1.422x. Above daily is clean air to back to the top of the range 1.451x....
For today intraday, Monthly / daily rejection of lows...
Wow...last hour's high gets the...about face. What about the previous hour? You have the three candles highlighted. Any significance of it, or is it just that pain in the arse elliptical tool in MT4?
Ignored
its a two bar combo...that you sometimes see at the end of a trend...the first candle makes a swing low and is the low close of the move, then the second candle's open/low holds the previous candles close...(this one took it out by tenths I think...) and closes above above the last candles high...I noticed them years ago in when I traded S&P's, on shorter term charts like the 1min/5min/15min...on those TF's it gave you a cheap play at trying to pick the low...also used them in the meats, grains, and softs on the hourly and daily TF's...
|
Membership Revoked
|
Joined Mar 2009
|16,693 Posts
Watching that too... But I knew it was going to print it before it did...
Either way the H1 shows bullish engulfing.... It took money to get that done. I don't think they'll let it go...
its a two bar combo...that you sometimes see at the end of a trend...the first candle makes a swing low and it the low close of the move, then the second candle open/low holds the previous candles close...(this one took it out by tenths I think...) and closes above above the last candles high...I noticed them years ago in when I traded S&P's, on shorter term charts like the 1min/5min/15min...on those TF's it gave you a cheap play at trying to pick the low...also used them in the meats, grains, and softs on the hourly and daily TF's...