• Home
  • Forums
  • Trades
  • News
  • Calendar
  • Market
  • Brokers
  • Login
  • Join
  • User/Email: Password:
  • 1:27pm
Menu
  • Forums
  • Trades
  • News
  • Calendar
  • Market
  • Brokers
  • Login
  • Join
  • 1:27pm
Sister Sites
  • Metals Mine
  • Energy EXCH
  • Crypto Craft

Options

Bookmark Thread

First Page First Unread Last Page Last Post

Print Thread

Similar Threads

4 Hour Strategy Macd+other Indicator 21 replies

average true range for 1 hour and 4 hour charts 2 replies

X-1102 1 hour , 4 hour and daily Tf trades 7 replies

Create a verticle line at certain hour for every certain hour 16 replies

Is the "4 Hour Strategy (MACD)" the best system here at FF? 20 replies

  • Commercial Content
  • /
  • Reply to Thread
  • Subscribe
  • 12,931
Attachments: 4 Hour Strategy (MACD)
Exit Attachments
Tags: 4 Hour Strategy (MACD)
Cancel

4 Hour Strategy (MACD)

  • Last Post
  •  
  • 1 12261227Page 122812291230 1579
  • 1 Page 1228 1579
  •  
  • Post #24,541
  • Quote
  • Aug 17, 2011 9:26pm Aug 17, 2011 9:26pm
  •  trademin
  • | Joined Apr 2007 | Status: Member | 910 Posts
Quoting Morelands
Disliked
Here is a possible set up on the GbP. Resistance becomes support? Look for a nice TC or candle formation. If it happens tonight I'll probably miss it. I've got to get some sleep.
Raymond
Ignored
Yes indeed something is cooking ! A TC from support is possible(...while you'll be sleeping! :-)
-maybe you'll be right on time when the door of the oven will open!

thanks for the Hint Moreland!

Yvon
Yvon
 
 
  • Post #24,542
  • Quote
  • Aug 17, 2011 10:55pm Aug 17, 2011 10:55pm
  •  Price Motion
  • | Joined Dec 2008 | Status: Member | 9 Posts
Dear All,

This trading strategy has proved to be invaluable. I have made profitable trades by just following the rules. Hope this will help you.

thanks.
Attached File(s)
File Type: doc 4hr rules.doc   26 KB | 1,180 downloads
"Flow with the market rhythm and the pips will come to you."
 
 
  • Post #24,543
  • Quote
  • Aug 18, 2011 12:01am Aug 18, 2011 12:01am
  •  trademin
  • | Joined Apr 2007 | Status: Member | 910 Posts
Quoting Price Motion
Disliked
Dear All,

This trading strategy has proved to be invaluable. I have made profitable trades by just following the rules. Hope this will help you.

thanks.
Ignored
thank you for bringing in a few pages the rules of the 4h.

I do very appreciate . I have already printed a copy for me. It is a very good work, I will take good care of it.

and as you wrote: "thank you very much Phillip!" hope you don't mind if I am joinning you on that sentence.
Yvon
Yvon
 
 
  • Post #24,544
  • Quote
  • Aug 18, 2011 6:43am Aug 18, 2011 6:43am
  •  wesh
  • | Membership Revoked | Joined Nov 2010 | 10 Posts
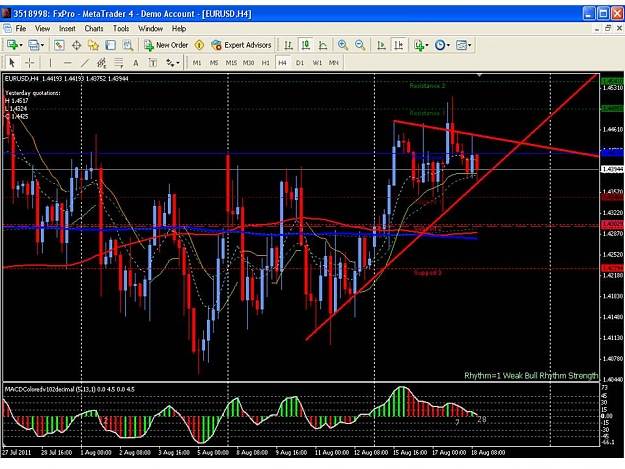
Hi, Traders, Have been following this thread for some time now.

Saw this TC, but have seen such pattern some time back. Didnot enter due to the trendlines and the huge SL.

Thanks Philip and the rest of the followers, Also Edonya, hez my mentor around here.


Comments are welcome...
Attached Image (click to enlarge)
Click to Enlarge

Name: FX.jpg
Size: 115 KB
 
 
  • Post #24,545
  • Quote
  • Edited 9:57am Aug 18, 2011 9:49am | Edited 9:57am
  •  Morelands
  • | Joined Feb 2008 | Status: Member | 585 Posts
Have not entered GBP, on the 15 min chart we are still making lower highs and lower low. Plus, it is getting a little late in the day to see any real moves, but who knows. Another reason not to go long is the open of the US stock market, risk off
Raymond
 
 
  • Post #24,546
  • Quote
  • Aug 18, 2011 7:31pm Aug 18, 2011 7:31pm
  •  NViet
  • | Joined Jan 2011 | Status: Member | 20 Posts
Hi,
does anyone have a programme which shows you size of a spread?
Thanks a lot!
 
 
  • Post #24,547
  • Quote
  • Aug 19, 2011 2:55am Aug 19, 2011 2:55am
  •  Morelands
  • | Joined Feb 2008 | Status: Member | 585 Posts
Long GBP TP at 6580 and 6600
 
 
  • Post #24,548
  • Quote
  • Edited 8:31am Aug 19, 2011 8:27am | Edited 8:31am
  •  Morelands
  • | Joined Feb 2008 | Status: Member | 585 Posts
I took half profit at 6568 and the rest at BE. Can't post the chart right now...typical
Raymond

Edit: out at 80 for the rest.
 
 
  • Post #24,549
  • Quote
  • Aug 19, 2011 10:53am Aug 19, 2011 10:53am
  •  Deathless
  • | Commercial Member | Joined May 2009 | 61 Posts
Quoting NViet
Disliked
Hi,
does anyone have a programme which shows you size of a spread?
Thanks a lot!
Ignored
Attaching one it is not a program, just indicator.. put it into Program Files/yourbrookermetatrader/experts/indicators/ restart metatrader..
Attached File(s)
File Type: mq4 Spread.mq4   3 KB | 283 downloads
 
 
  • Post #24,550
  • Quote
  • Edited 6:07pm Aug 19, 2011 5:00pm | Edited 6:07pm
  •  Morelands
  • | Joined Feb 2008 | Status: Member | 585 Posts
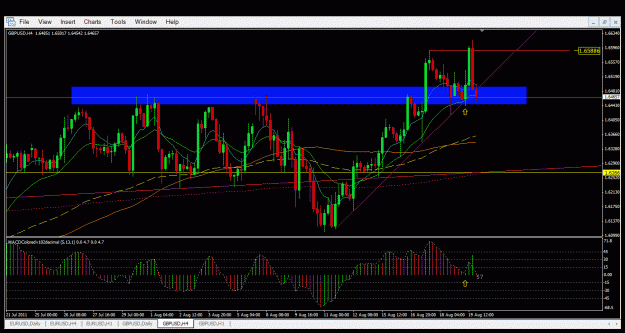
Here is my trade for the day. The 1st chart is the 4 hr. The blue rectangle shows resistance from previous price action. Also providing support is the trend line and the 21 MA (green). That is a lot of reasons to be long at that time. I did not enter on the TC indicated by the arrows. If I would have I would have gotten a better entry price. Mine was 6513
The second chart is the 1 hr. The yellow arrow shows where I entered. Price initially shot up the the high 20's maybe even reached 30, I don't really remember. All I know is it went from 00 to the high 20's quickly. I entered when price came down a bit. The point is you can see how the close of the 1 hr candle engulfs a lot of previous candles. That shows strength to the up side. Given all the reasons I stated before to go long, this seemed like the time to do it. You can see the tail of the next candle actually took out the low of the candle I entered on. If I would of had a tight SL it would have been taken out. I mentioned in my previous posts how that can happen and how much I like when that happens.
The next chart shows where a more seasoned trader would have exited, see the divergence. But I got a little chicken, to be honest, and closed the 1st at 68 (At least I think...I posted it earlier) and 80. I based the 80 on the previous high and 6600 b/c it was a round #.
That's it
Raymond
Attached Image(s) (click to enlarge)
Click to Enlarge

Name: 081911-part1.gif
Size: 37 KB
Click to Enlarge

Name: 081911-part2.gif
Size: 32 KB
Click to Enlarge

Name: 081911-part3.gif
Size: 31 KB
 
 
  • Post #24,551
  • Quote
  • Aug 20, 2011 2:26pm Aug 20, 2011 2:26pm
  •  trademin
  • | Joined Apr 2007 | Status: Member | 910 Posts
Quoting Morelands
Disliked
Here is my trade for the day. The 1st chart is the 4 hr. The blue rectangle shows resistance from previous price action. Also providing support is the trend line and the 21 MA (green). That is a lot of reasons to be long at that time. I did not enter on the TC indicated by the arrows. If I would have I would have gotten a better entry price. Mine was 6513
The second chart is the 1 hr. The yellow arrow shows where I entered. Price initially shot up the the high 20's maybe even reached 30, I don't really remember. All I know is it went from 00 to...
Ignored

congrats! nice shot. - the ironic part is that I was not around for that trade that you annonced in advance---nice trade!
Yvon
Yvon
 
 
  • Post #24,552
  • Quote
  • Aug 20, 2011 3:44pm Aug 20, 2011 3:44pm
  •  Morelands
  • | Joined Feb 2008 | Status: Member | 585 Posts
Quoting trademin
Disliked
congrats! nice shot. - the ironic part is that I was not around for that trade that you annonced in advance---nice trade!
Yvon
Ignored
thanks, sorry you missed it. Did you get my pm
Raymond
 
 
  • Post #24,553
  • Quote
  • Aug 27, 2011 9:38am Aug 27, 2011 9:38am
  •  Morelands
  • | Joined Feb 2008 | Status: Member | 585 Posts
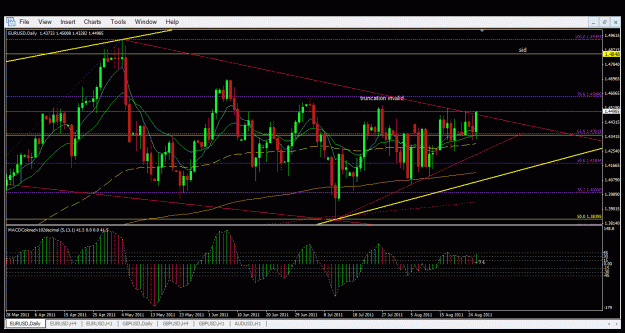
Looks like there are higher prices to come based on the daily candle. Look for consolidation, TC, and/or candle patterns
Attached Image (click to enlarge)
Click to Enlarge

Name: 082711-nt.gif
Size: 40 KB
 
 
  • Post #24,554
  • Quote
  • Aug 27, 2011 9:56am Aug 27, 2011 9:56am
  •  geniusztc
  • Joined Jun 2010 | Status: Hello,Mr.Market | 1,805 Posts
Quoting Morelands
Disliked
Looks like there are higher prices to come based on the daily candle. Look for consolidation, TC, and/or candle patterns
Ignored
isnt it a fake breaking? i always confuse about it .
A chart helps those who can read it.
 
 
  • Post #24,555
  • Quote
  • Aug 27, 2011 1:02pm Aug 27, 2011 1:02pm
  •  Hookem28
  • | Joined Sep 2007 | Status: Member | 438 Posts
Quoting Morelands
Disliked
Looks like there are higher prices to come based on the daily candle. Look for consolidation, TC, and/or candle patterns
Ignored
You having any success with this pair, Morelands?
Ii's been so jerky-jerky that I've been trading primarily EURGBP and GBPUSD using the 4-Hour Strategy.
 
 
  • Post #24,556
  • Quote
  • Edited Aug 28, 2011 8:29am Aug 27, 2011 1:55pm | Edited Aug 28, 2011 8:29am
  •  Morelands
  • | Joined Feb 2008 | Status: Member | 585 Posts
Quoting Hookem28
Disliked
You having any success with this pair, Morelands?
Ii's been so jerky-jerky that I've been trading primarily EURGBP and GBPUSD using the 4-Hour Strategy.
Ignored
Yes, I've been primarily trading this one and I think I've posted some of the trades on the site. The GBP/USD has been the one I've avoided recently b/c I just haven't seen anything, except for the one I took towards the end of last week. Apparently you are seeing more, so good for you. Sometimes I guess each one of us sees different things. I do think it has been tough trading recently. However, I think we have broken out of the ranging period on the EUR/USD until we hit b/t 1.4850 and 1.5150. (If you follow Elliot wave, I thing we have started the 5th wave of the c correction) Once we get up to that range and I see divergance on the 4hr, I'm going to place a larger trade than normal (maybe 2-3% of my capital). I'll take some off the table and let the rest run b/c I think we are going to see a big run down. We should see the S&P begin to fall then too. That is just one of my long term plans and we see whether it shows up in the charts.

Good to see you. I wish you would post more of your trades. Many pips to you
Raymond

Edit: Actually, GBP was 2 times recently
 
 
  • Post #24,557
  • Quote
  • Aug 28, 2011 7:16pm Aug 28, 2011 7:16pm
  •  NViet
  • | Joined Jan 2011 | Status: Member | 20 Posts
Quoting Morelands
Disliked
Yes, I've been primarily trading this one and I think I've posted some of the trades on the site. The GBP/USD has been the one I've avoided recently b/c I just haven't seen anything, except for the one I took towards the end of last week. Apparently you are seeing more, so good for you. Sometimes I guess each one of us sees different things. I do think it has been tough trading recently. However, I think we have broken out of the ranging period on the EUR/USD until we hit b/t 1.4850 and 1.5150. (If you follow Elliot wave, I thing we have started...
Ignored
Hi Morelands,
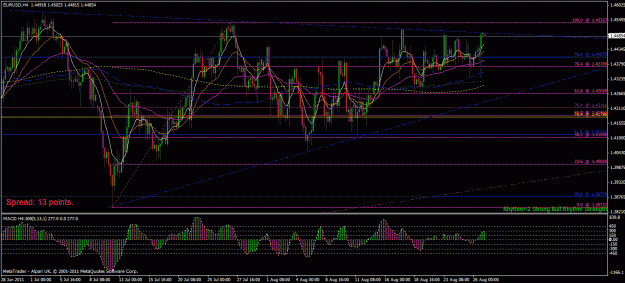
I have the same opinion like you. Maybe it will pull back to 8ema on 4h and than it will breaks the trendline. My trendline is a little bit different. But according to 1d chart I would expect higher prices come up. The videos by sion smith that you recommend on this thread helped me a lot. I would like to say thank you.
Attached Image (click to enlarge)
Click to Enlarge

Name: graf1.gif
Size: 40 KB
 
 
  • Post #24,558
  • Quote
  • Edited Sep 1, 2011 4:29am Aug 31, 2011 7:55am | Edited Sep 1, 2011 4:29am
  •  ganoderma
  • | Joined Aug 2011 | Status: Member | 12 Posts
Hi everyone,

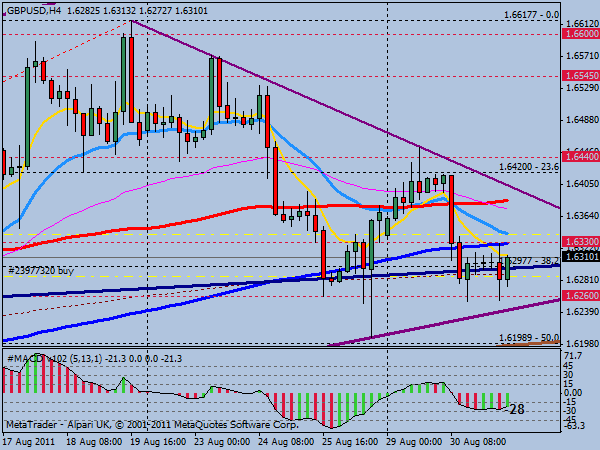
Been following this thread for a while, and this a trade that I just took. Wonder if this is the right trade according to 4H rule. I took it because price seems to develop double bottom with those 3 pin bars in m30. Hope that it will reach my TP.

EDIT: Out +29 pips
Attached Images
 
 
  • Post #24,559
  • Quote
  • Aug 31, 2011 7:28pm Aug 31, 2011 7:28pm
  •  Morelands
  • | Joined Feb 2008 | Status: Member | 585 Posts
It looked like a good trade to me. I would have entered after the green candle. The green candle closed above the pin bars. Once it closes above I would enter on the following candle trying to get the best price. On CT trades take profit when you can. Nice job
Raymond

Quoting ganoderma
Disliked
Hi everyone,

Been following this thread for a while, and this a trade that I just took. Wonder if this is the right trade according to 4H rule. I took it because price seems to develop double bottom with those 3 pin bars in m30. Hope that it will reach my TP.

EDIT: Out +29 pips
Ignored
 
 
  • Post #24,560
  • Quote
  • Edited Sep 1, 2011 4:30am Aug 31, 2011 9:18pm | Edited Sep 1, 2011 4:30am
  •  ganoderma
  • | Joined Aug 2011 | Status: Member | 12 Posts
Quoting Morelands
Disliked
It looked like a good trade to me. I would have entered after the green candle. The green candle closed above the pin bars. Once it closes above I would enter on the following candle trying to get the best price. On CT trades take profit when you can. Nice job
Raymond
Ignored
Thanks for the advice, Raymond. It actually almost reached my TP by only 10 pips difference. I decided to close when I saw that price seems couldn't reached my target TP.
Attached Image
 
 
  • Commercial Content
  • /
  • 4 Hour Strategy (MACD)
  • Reply to Thread
    • 1 12261227Page 122812291230 1579
    • 1 Page 1228 1579
1 trader viewing now
  • More
Top of Page
  • Facebook
  • Twitter
About FF
  • Mission
  • Products
  • User Guide
  • Media Kit
  • Blog
  • Contact
FF Products
  • Forums
  • Trades
  • Calendar
  • News
  • Market
  • Brokers
  • Trade Explorer
FF Website
  • Homepage
  • Search
  • Members
  • Report a Bug
Follow FF
  • Facebook
  • Twitter

FF Sister Sites:

  • Metals Mine
  • Energy EXCH
  • Crypto Craft

Forex Factory® is a brand of Fair Economy, Inc.

Terms of Service / ©2023