• Home
  • Forums
  • Trades
  • News
  • Calendar
  • Market
  • Brokers
  • Login
  • Join
  • 6:07pm
Menu
  • Forums
  • Trades
  • News
  • Calendar
  • Market
  • Brokers
  • Login
  • Join
  • 6:07pm
Sister Sites
  • Metals Mine
  • Energy EXCH
  • Crypto Craft

Options

Bookmark Thread

First Page First Unread Last Page Last Post

Print Thread

Similar Threads

Close Price VS Median Price (or other price types) 33 replies

House price data price action 1 reply

Why closing price is not the same as opening price? 1 reply

Price on charts vs. Bid and Ask price 1 reply

differences between chart price and trading price 2 replies

  • Trading Discussion
  • /
  • Reply to Thread
  • Subscribe
  • 2,270
Attachments: Romancing the Price
Exit Attachments
Tags: Romancing the Price
Cancel

Romancing the Price

  • Last Post
  •  
  • 1 2122Page 232425 105
  • 1 Page 23 105
  •  
  • Post #441
  • Quote
  • Jul 25, 2011 10:04pm Jul 25, 2011 10:04pm
  •  frankkn
  • Joined Jan 2010 | Status: I'm the greatest, man | 2,516 Posts
Quoting aud
Disliked
Great post frank. Do not be too concerned with any criticism you may get of this post in another thread. Good to see you keeping an open mind.

Best of luck with your goals.
Ignored
Thank you pal

No concerns. I am hungry for criticism, it may sound crazy but I truly enjoy it. If the criticism has any value then it will do nothing but make me $
 
 
  • Post #442
  • Quote
  • Jul 25, 2011 10:08pm Jul 25, 2011 10:08pm
  •  KennyZ
  • Joined Jul 2010 | Status: KIS | 1,578 Posts
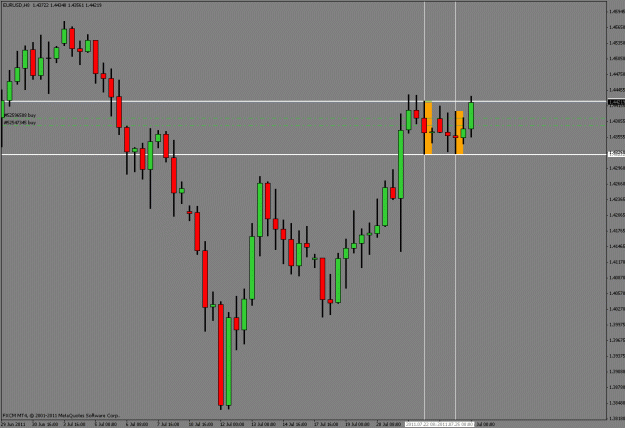
couple of closed latest eu scalp trades..

i've been holding the lower one fairly long time for my standards..

most of the time being patient pays better..
Attached Image
 
 
  • Post #443
  • Quote
  • Edited 10:59pm Jul 25, 2011 10:49pm | Edited 10:59pm
  •  taomql4
  • Joined Dec 2008 | Status: Resident Psychiatrist!!! | 2,600 Posts
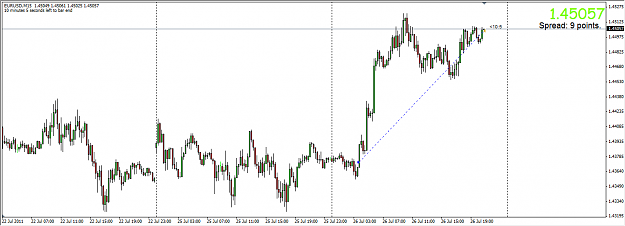
Update :

For me , I did not get the usual 2 layers of strength I normally look for on the 4 hr TF , but there was a reason for it .. One was created on the 8 hr TF , so I took that ..

Now Remember - If You short, the Monkeys win !!

Inserted Video


Good nite !!!
Attached Image (click to enlarge)
Click to Enlarge

Name: eu3.gif
Size: 21 KB
 
 
  • Post #444
  • Quote
  • Jul 26, 2011 3:44am Jul 26, 2011 3:44am
  •  atton
  • | Joined Apr 2009 | Status: Member | 290 Posts
Quoting KennyZ
Disliked
couple of closed latest eu scalp trades..

i've been holding the lower one fairly long time for my standards..

most of the time being patient pays better..
Ignored
Hey Kenny may you eXplain your second e/u entry. thanks in advance
 
 
  • Post #445
  • Quote
  • Jul 26, 2011 6:37am Jul 26, 2011 6:37am
  •  KennyZ
  • Joined Jul 2010 | Status: KIS | 1,578 Posts
hi atton,

second entry doesn't look like a conventional supply and demand trading.. usually, you wouldn't buy within supply cluster but i was bullish about eu since last sunday.. see my charts added here on sunday: http://www.forexfactory.com/showthre...06#post4805106

keeping in mind supply was hit few times and momentum bars.. just took first possible bull flag.. same thing i did with gu and au


Quoting atton
Disliked
Hey Kenny may you eXplain your second e/u entry. thanks in advance
Ignored
 
 
  • Post #446
  • Quote
  • Jul 26, 2011 1:48pm Jul 26, 2011 1:48pm
  •  supremeChaos
  • Joined Feb 2009 | Status: Borderline yahoo & oh-no! | 6,607 Posts
Quoting KennyZ
Disliked
i hope i'm not too late.. just seen it.. explanation texts are on the candle..
Ignored
Don't be fooled, that's Itachi!
 
 
  • Post #447
  • Quote
  • Jul 26, 2011 2:24pm Jul 26, 2011 2:24pm
  •  Orbital
  • Joined Jan 2010 | Status: Amat victoria curam | 2,333 Posts
boring day

Attached Image (click to enlarge)
Click to Enlarge

Name: done4theday.png
Size: 23 KB
 
 
  • Post #448
  • Quote
  • Jul 26, 2011 2:45pm Jul 26, 2011 2:45pm
  •  aligater
  • | Joined Jan 2011 | Status: my blog www.ijhas.blogspot.com | 1,038 Posts
Hello Folks
I do not remmember who I have seen postiong that he has few positions on few Pairs ..
let me ask this, what is the logic behind having positions on few paires,,if not hedging..
why not put the whole investment on one instrument?


aligater
born to speculate
 
 
  • Post #449
  • Quote
  • Jul 26, 2011 3:10pm Jul 26, 2011 3:10pm
  •  KennyZ
  • Joined Jul 2010 | Status: KIS | 1,578 Posts
there is this old saying comes into mind..

"Don't put all your eggs in one basket"


Quoting aligater
Disliked
Hello Folks
I do not remmember who I have seen postiong that he has few positions on few Pairs ..
let me ask this, what is the logic behind having positions on few paires,,if not hedging..
why not put the whole investment on one instrument?


aligater
Ignored
 
 
  • Post #450
  • Quote
  • Jul 26, 2011 3:45pm Jul 26, 2011 3:45pm
  •  Porkpie
  • Joined Mar 2007 | Status: Member | 1,142 Posts
Quoting aligater
Disliked
Hello Folks
I do not remmember who I have seen postiong that he has few positions on few Pairs ..
let me ask this, what is the logic behind having positions on few paires,,if not hedging..
why not put the whole investment on one instrument?


aligater
Ignored
For the same reason anyone trades several pairs, spreading risk per trade (as long as all pairs are uncorrelated), frequency (more trades on a time frame that suits), and diversity.
 
 
  • Post #451
  • Quote
  • Jul 26, 2011 5:42pm Jul 26, 2011 5:42pm
  •  ba1ker
  • Joined Feb 2010 | Status: Inactive | 6,482 Posts
Quoting frankkn
Disliked
H4 EU

Edit:

Just wanted to share some thoughts

When you're a beast of a trader like IF, Orbital, Kenny, or Emene your intuition can guide you when it comes to trading SD levels. Like Orbital mentioned in his excellent post above, he would miss lots of trades by waiting for engulfings.

I am a conservative trader, and as such the safety that an engulfing brings me helps me a lot in my trading. It is almost like a safety net that helps me manage my trade more efficiently. I am only looking for a handful of trades per week, because...
Ignored
That's bang on bro! Sweet as a nut. Let's go fishing!
 
 
  • Post #452
  • Quote
  • Jul 28, 2011 7:37pm Jul 28, 2011 7:37pm
  •  KennyZ
  • Joined Jul 2010 | Status: KIS | 1,578 Posts
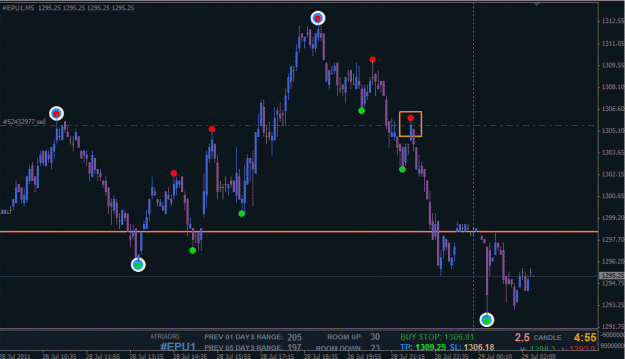
one of my recently closed trade...

would you have sold here [yellow rectangle].. try not to view right side from sell point and look to the left.. for this i have also put second chart with right of entry blanked for your convenience..

how do you read the pa...

you may download, add remarks etc and upload the chart..
Attached Image(s) (click to enlarge)
Click to Enlarge

Name: rtp_sp_jul_d001.gif
Size: 26 KB
Click to Enlarge

Name: rtp_sp_jul_d001b.gif
Size: 23 KB
 
 
  • Post #453
  • Quote
  • Edited 9:24pm Jul 28, 2011 8:42pm | Edited 9:24pm
  •  andy9775
  • | Joined Mar 2009 | Status: Member | 89 Posts
Quoting KennyZ
Disliked
one of my recently closed trade...

would you have sold here [yellow rectangle].. try not to view right side from sell point and look to the left.. for this i have also put second chart with right of entry blanked for your convenience..

how do you read the pa...

you may download, add remarks etc and upload the chart..
Ignored
The initial test of the level and rather quick retreat shows lots of supply there. Then the level finally gets broken and we start to see exhaustion. First the highest high on your chart 1312ish from what I can tell shows consolidation/indecision (if you throw on an oscillator or some sort of indicator you will most likely see some divergence). Finally between this high and your entry we see consolidation (indecision again) sellers eventually win and prices drop. The level eventually gets broken and sellers take a break while price pulls up. Important to note that the candle that you entered on is included in an m15 doji.
EDIT: The second test of the level (looks like your broker is 7 hours ahead of EST if so at 15:45) has candles opening lower then the close of the candle which shows supply/selling.

By the level I mean your entry point as a s/r or s/d level.

Id appreciate any input, if Im reading something wrong or missed something.
Attached Image (click to enlarge)
Click to Enlarge

Name: entry.png
Size: 125 KB
 
 
  • Post #454
  • Quote
  • Jul 28, 2011 9:11pm Jul 28, 2011 9:11pm
  •  Ifmyante
  • | Commercial Member | Joined Nov 2010 | 3,062 Posts
Quoting andy9775
Disliked
The initial test of the level and rather quick retreat shows lots of supply there. Then the level finally gets broken and we start to see exhaustion. First the highest high on your chart 1312ish from what I can tell shows consolidation/indecision (if you throw on an oscillator or some sort of indicator you will most likely see some divergence). Finally between this high and your entry we see consolidation (indecision again) sellers eventually win and prices drop. The level eventually gets broken and sellers take a break while price pulls up. Important...
Ignored
I'd love to respond, but I'm really bad at letting any information about a chart soak in which isn't posted on a chart.

I did try, believe me. Maybe it's just way past my bedtime
 
 
  • Post #455
  • Quote
  • Jul 28, 2011 9:17pm Jul 28, 2011 9:17pm
  •  Rufus
  • Joined Feb 2009 | Status: Illegitimi non carborundum | 3,523 Posts
Quoting Ifmyante
Disliked
I'd love to respond, but I'm really bad at letting any information about a chart soak in which isn't posted on a chart.

I did try, believe me. Maybe it's just way past my bedtime
Ignored
I would say he sold it there for profit....

Good catch Kenny.. Someday I will be adding the E-minis to my repertoire


Rufus
Illegitimi non carborundum - Noli pati a scelestis opprimi.
 
 
  • Post #456
  • Quote
  • Jul 29, 2011 11:12pm Jul 29, 2011 11:12pm
  •  KennyZ
  • Joined Jul 2010 | Status: KIS | 1,578 Posts
nice analysis on chart andy.. good job..

the reason i took the trade before your possible entry candle was previous supply levels matched to my entry point.. i found that sometimes looking whole price structure pays better than just looking to current pa for entry point...

have many good ones.....

Quoting andy9775
Disliked
...
Id appreciate any input, if Im reading something wrong or missed something.
Ignored
 
 
  • Post #457
  • Quote
  • Edited Jul 30, 2011 12:46am Jul 29, 2011 11:28pm | Edited Jul 30, 2011 12:46am
  •  KennyZ
  • Joined Jul 2010 | Status: KIS | 1,578 Posts
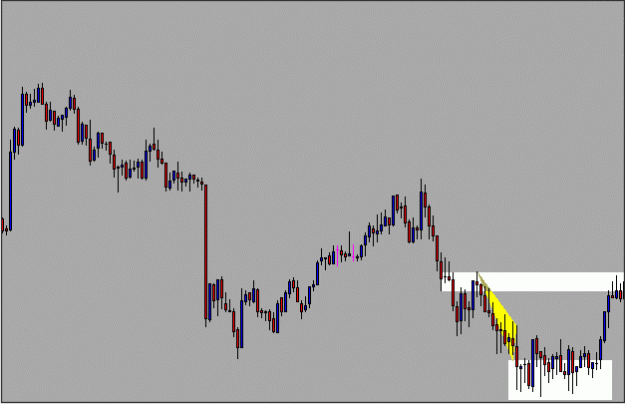
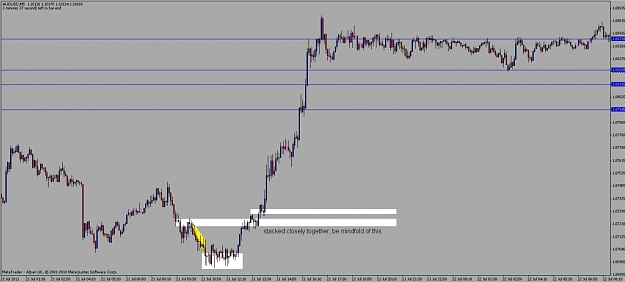
lets talk about the chart below.. it's one of Red's chart..

can you read the future pa from what you see on this chart... would you buy or sell from what you see.. if so why and where?

i cut out time, price and pair info as they are not really important when it comes to reading pa

as Red says, any time.. any price.. any instrument...

ps/. it would be nice and clear if you could put your comments on the chart with pointers etc.
Attached Image (click to enlarge)
Click to Enlarge

Name: rtp_work_jul_d001.gif
Size: 8 KB
 
 
  • Post #458
  • Quote
  • Jul 30, 2011 12:37am Jul 30, 2011 12:37am
  •  mangalesh
  • | Joined Jul 2010 | Status: Member | 306 Posts
A spike and drop of this supply zone earlier to demand zone has happened so we should look for long here after a bull engulf completes above this zone with sl below this supply zone . Tg should be the place wer a big red candle has dropped on the left ..So will look to long here ..

Another thing ,

Sellers zone has been weakened compared to buyer . Buyer zone came to supply zone from demand in just 3 to 4 candles while sellers zone has lots of candles .It should be buyer zone now

Correct me if am wrong ..


Thanks


Quoting KennyZ
Disliked
lets talk about the chart below.. it's one of Red's chart..

can you read the future pa from what you see on this chart... would you buy or sell from what you see.. if so why and where?

i cut out time, price and pair info as they are not really important when it comes to reading pa

as Red says, any time.. any price.. any instrument...
Ignored
Trading is all about probability, low risk/high reward ,buy low/sell high
 
 
  • Post #459
  • Quote
  • Jul 30, 2011 10:41am Jul 30, 2011 10:41am
  •  husain
  • | Joined Jan 2011 | Status: Member | 7 Posts
hey kenny..
iam probably vry new to forex.. but find urs orbital's, infymante's and some other peoples posts vry helpful. iam vry thankful to u guyz for taking out time to post ur trades and show us all a path of how to trade of s/d areas properly.

iam vry new to this but still if i was looking at this chart ..i wud had drawn a rectangle at the high and low of the consolidation which is going on in the supply zone and wud enter long if upper line is broken otherwise short if downward...
looking at the price structure and price arrival into the supply zone i think going short wud b a safe bet..

all positive critics welcome...

thanku all guyz again...
 
 
  • Post #460
  • Quote
  • Jul 31, 2011 11:26am Jul 31, 2011 11:26am
  •  KennyZ
  • Joined Jul 2010 | Status: KIS | 1,578 Posts
here is the full chart from Red...

you can still add your comments..

idea is to get you traders into discussion.. learning from each other.. remember there is no advance single right or wrong when it comes to markets..

i welcome those traders who have the time and balls to add their own views here instead of nick-picking....
Attached Image (click to enlarge)
Click to Enlarge

Name: rtp_work_full_jul_d001.jpg
Size: 74 KB
 
 
  • Trading Discussion
  • /
  • Romancing the Price
  • Reply to Thread
    • 1 2122Page 232425 105
    • 1 Page 23 105
0 traders viewing now
  • More
Top of Page
  • Facebook
  • X
About FF
  • Mission
  • Products
  • User Guide
  • Media Kit
  • Blog
  • Contact
FF Products
  • Forums
  • Trades
  • Calendar
  • News
  • Market
  • Brokers
  • Trade Explorer
FF Website
  • Homepage
  • Search
  • Members
  • Report a Bug
Follow FF
  • Facebook
  • X

FF Sister Sites:

  • Metals Mine
  • Energy EXCH
  • Crypto Craft

Forex Factory® is a brand of Fair Economy, Inc.

Terms of Service / ©2023