I would say that trade has been done. I know a handful of people that had that.
Ignored
This is interesting. You mean that if the price comes 10-15 pips from the level u identify and bounces from there you would consider the level as exhausted? Why?
This is interesting. You mean that if the price comes 10-15 pips from the level u identify and bounces from there you would consider the level as exhausted? Why?
Ignored
I think from chart watching you do notice where price has nearly reached a level and its almost like it has touched it but just quite not exactly as per the S/R Level on our charts. Remember try to think of these areas more of zones rather then a specific point.
I love acceleration into my level but I want the market to have been moving that way for several H1 candles in a row. I don't like trading the first H1 bar that is accelerating out of a sideways congestion.
I love acceleration into my level but I want the market to have been moving that way for several H1 candles in a row. I don't like trading the first H1 bar that is accelerating out of a sideways congestion.
Ignored
Tom,
Can you provide an example for the above statement ?
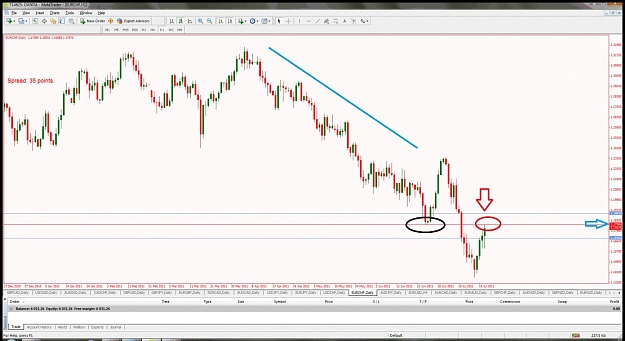
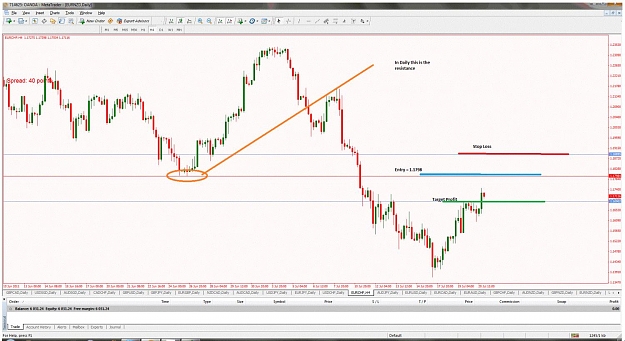
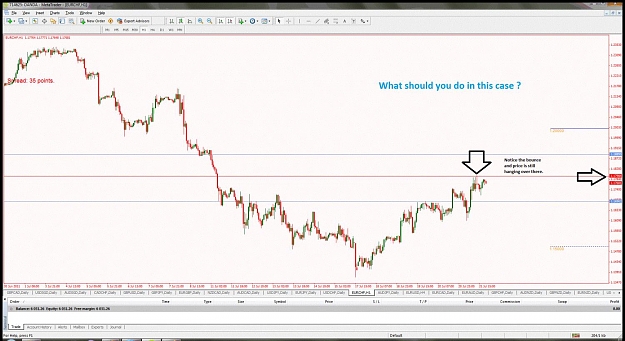
I put a sell limit order on EURCHF at 1.1798 based on the daily Support level. But I cancelled the order just 20 pips before hitting the price. I cancelled the price since all EUR pairs behaving bullishly due to EURO bailout talks.
In fact price did bounce from that point.. though bounce was not very strong.. the price is currently around that price only. Attached are Daily, H4 and H1 charts.
Can you provide an example for the above statement ?
I put a sell limit order on EURCHF at 1.1798 based on the daily Support level. But I cancelled the order just 20 pips before hitting the price. I cancelled the price since all EUR pairs behaving bullishly due to EURO bailout talks.
In fact price did bounce from that point.. though bounce was not very strong.. the price is currently around that price only. Attached are Daily, H4 and H1 charts.
I think from chart watching you do notice where price has nearly reached a level and its almost like it has touched it but just quite not exactly as per the S/R Level on our charts. Remember try to think of these areas more of zones rather then a specific point.
So if the price reached to ATR top or bottom, does not it mean, pair will not move futher much since price had its average momentum for that day ?
May be I am not getting the point here.
Ignored
Morning cprao
Yes thats the idea but remeber it is only the AVERAGE true range. Some days- like yesterday particularly in the Aussie and Euro pairs it smashed right through its ATR so as I said its only a guide - does'nt mean that it will hit to the pip and bounce !! (I wish lol). Its just another layer of confluence to bear in mind.
I am looking at/demoing the ATR indi at present when it corresponds with an hourly level/ supply demand zone AND a 1 hr SFP and so far it looks pretty good - only started with it this last week so early days but so far it has pretty much always made it back to the FTA, sometimes only 15 or so pips but a couple of 40-50 pips runners.
Yes thats the idea but remeber it is only the AVERAGE true range. Some days- like yesterday particularly in the Aussie and Euro pairs it smashed right through its ATR so as I said its only a guide - does'nt mean that it will hit to the pip and bounce !! (I wish lol). Its just another layer of confluence to bear in mind.
I am looking at/demoing the ATR indi at present when it corresponds with an hourly level/ supply demand zone AND a 1 hr SFP and so far it looks pretty good - only started with it this last week so early days but...
Ignored
Good Morning.
Thank you for the explanation. Makes sense. Also interested to see couple of examples of your demo.
Just took profits on this move up off 126.65 in the Bund.
It squeezed a little but not enough to get Uncle Wiz out (remember earlier posts about stop beneath the last thrust candle that opens below and closes through the level you are trading if you are going short) :-)
Tweeted it live this morning but not sure who is following.
At any rate ; this was a great setup.
- Very clearly defined S/R pivot that is also a D1 level.
- The level was the inverse e.g. resistance last where we are looking to buy
- It is the first...
Ignored
Great, I was in that as well, nice to see that I am looking at the same levels as you. Long at 126.67 out at 126.93.
So its the same as the ATR indicator? Im confused lol.
Ignored
ATR is calculated a little differently than average daily range. What I've been doing with the indicator is to look at today's range and compare to the ATR for the day. As Malarky said I would only use it for confluence. Have found it to work pretty good in combination with a good level.