Hello
Mathematic rules are way back in my memory.
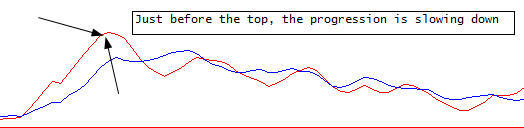
I want to caculate the rate of progression on a curve.
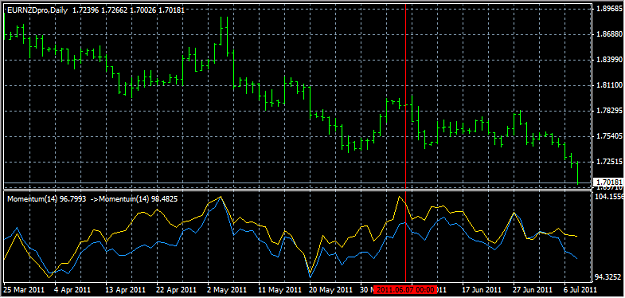
The curve is from an adx indicator. before turning down, the indicator as slowed down the curve. If i could caculate the progression of the curve, maybe i could enter in the market more precisely
Hope I'm clear enough with my not-so-good English
Martin
Mathematic rules are way back in my memory.
I want to caculate the rate of progression on a curve.
The curve is from an adx indicator. before turning down, the indicator as slowed down the curve. If i could caculate the progression of the curve, maybe i could enter in the market more precisely
Hope I'm clear enough with my not-so-good English
Martin
Attached Image