I have a question....First, a trade is signaled and then triggered. Then, soon afterward, and before the stoploss is hit, a trade signals and triggers in the opposite direction. Should we exit the trade (but not take the new trade)? ...or should we wait until the original stoploss is hit?
I set this trade up on Friday. I used a few different indicators to confirm this trade (both oscillators).
This is called the "Angulation Trade" and is one of Bill Williams favorite trades.
This is also the premise of the approach to the balance line. Look for divergent candles that close at a steep angle from the Blue line. Set your pending order (which in this case for me - took 2 trading day!)
It triggered last night - currently at +26 pips with 10 pips locked in.
If you haven't already done so - Get the book Trading Chaos Second Edition!...
I have a question....First, a trade is signaled and then triggered. Then, soon afterward, and before the stoploss is hit, a trade signals and triggers in the opposite direction. Should we exit the trade (but not take the new trade)? ...or should we wait until the original stoploss is hit?
Ignored
I would be thinking that the price is in a congestion.
Also look at balance line, 50ma S/R The rules are to sit on your hands but is it in a trend. Should you have taken the first move?
Could you post the chart so I can have a look?
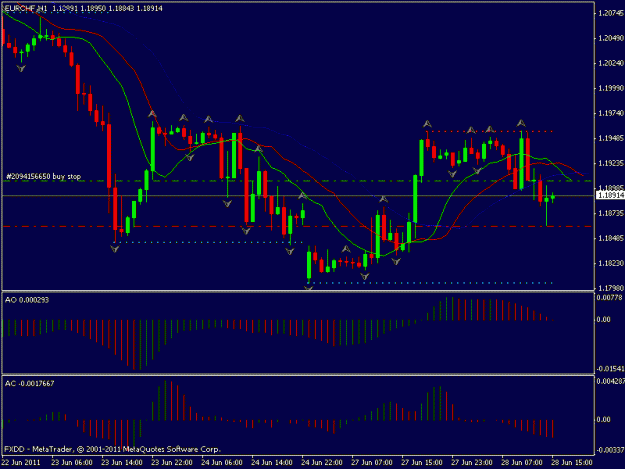
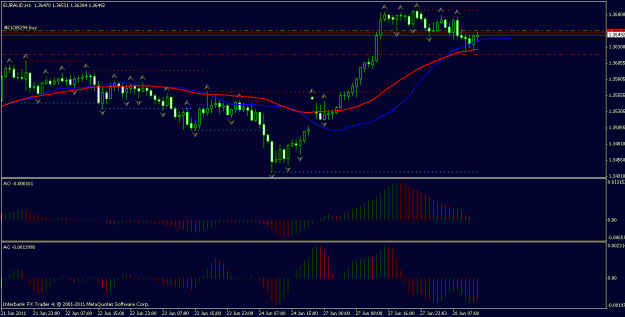
Do you think this would be a good entry for an "Angulation Trade"? (Long EURCHF)
Thanks,
Jerry
Ignored
Hi jerry
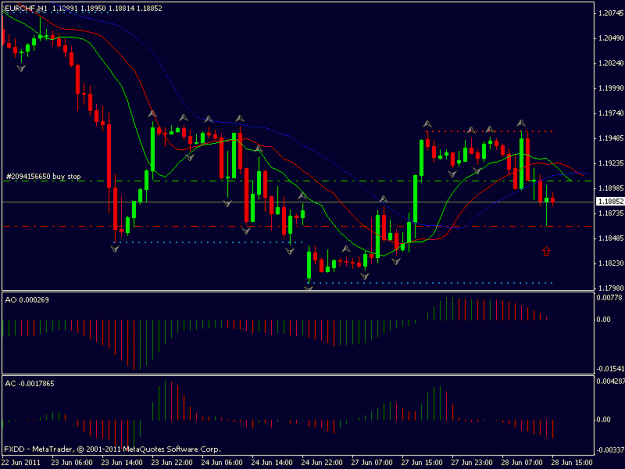
Looks to me like a congestion breakout. I am at a bit of a loss as to where you entered the trade. I would be expecting price to retest the 50 or balance line then go into a bearish move. Could you mark up the chart as to where you took the trade?
Right idea - candle isn't far enough away from the blue line. Generally Angulation trades happen when price has gone up or down really fast and continues for 8 to 10 bars, and then signals reversal with a divergent candle the other direction.
The best advice I can give about learning angulation trades is to read Bill Williams Book "Trading Chaos" second edition
Thanks for responding. I'm looking to go long at the top of the divergent candle. I understand what you are saying that it could retest the balanc line and then go bearish. The "Angulation Trade" that Colostarr mentioned in his post is a countertrend maneuver...
Looks to me like a congestion breakout. I am at a bit of a loss as to where you entered the trade. I would be expecting price to retest the 50 or balance line then go into a bearish move. Could you mark up the chart as to where you took the trade?
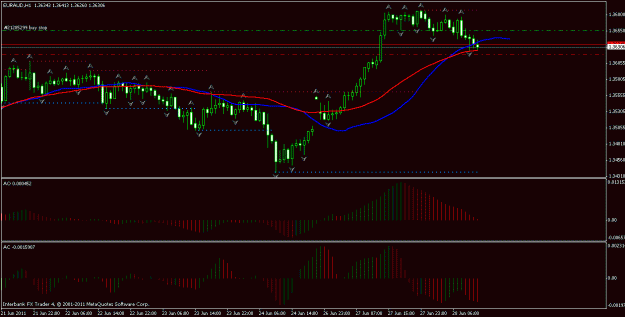
Neil I posted an example of an angulation trade this morning on the USDCAD. I set the stop friday evening before I lost internet. It triggered last night
Looks to me like a congestion breakout. I am at a bit of a loss as to where you entered the trade. I would be expecting price to retest the 50 or balance line then go into a bearish move. Could you mark up the chart as to where you took the trade?
Thanks for responding. I've read it a couple times, along with his other two books. Going to read them again this week... Thanks for the advice! I believe I have become a better trader this past week after discovering this thread. Although, one profitable day doesn't get it (yesterday). We shall see if I can swing a few profitable days together.
Right idea - candle isn't far enough away from the blue line. Generally Angulation trades happen when price has gone up or down really fast and continues for 8 to 10 bars, and then signals reversal with a divergent candle the other direction.
The best advice I can give about learning angulation trades is to read Bill Williams Book "Trading Chaos" second edition
Neil I posted an example of an angulation trade this morning on the USDCAD. I set the stop friday evening before I lost internet. It triggered last night
I would be thinking that the price is in a congestion.
Also look at balance line, 50ma S/R The rules are to sit on your hands but is it in a trend. Should you have taken the first move?
Could you post the chart so I can have a look?
Ignored
I agree.....that a reverse signal might be indicating entering a range bound market. I don't have a chart handy.....it was just a theoretical question. I guess my question would be: does a reverse signal trump a not-yet-hit stoploss? I'm thinking that it would unless I am less than half the way back to the stoploss.
Thanks for responding. I've read it a couple times, along with his other two books. Going to read them again this week... Thanks for the advice! I believe I have become a better trader this past week after discovering this thread. Although, one profitable day doesn't get it (yesterday). We shall see if I can swing a few profitable days together.