Be careful with this type of entry, resistance would have been too close for me to enter off that bounce. Let us know how it played out!
Ignored
Yeah just bit me. should of took it with 25 or so pips at that resistance but really thought it would keep going. Thanks for the tip and its noted. Thanks again for a great system.
That was a nice entry. I think I would have set the trade from the candle previous to the one you did. Especially considering it bounced off the 50 ema here. You may have been able to lock in +10 pips before it moved against you.
Once you are at BE, that, to me anyway is a the 1st victory in trading. You just won the battle and now it`s time to fight the war!
I am still in the Eur/Usd. Should of locked some in. Still getting a feel and need to be more aware of whats going on. Careless on my part with 2 trades. Should be around 35 pips but hovering at even
That was a nice entry. I think I would have set the trade from the candle previous to the one you did. Especially considering it bounced off the 50 ema here. You may have been able to lock in +10 pips before it moved against you.
Once you are at BE, that, to me anyway is a the 1st victory in trading. You just won the battle and now it`s time to fight the war!
Ignored
Yep I see it now. Damn it.
Thanks man. Its comments like you just made that is good for a traders self esteem. I am ready to keep moving forward.
Yeah just bit me. should of took it with 25 or so pips at that resistance but really thought it would keep going. Thanks for the tip and its noted. Thanks again for a great system.
I am still in the Eur/Usd. Should of locked some in. Still getting a feel and need to be more aware of whats going on. Careless on my part with 2 trades. Should be around 35 pips but hovering at even
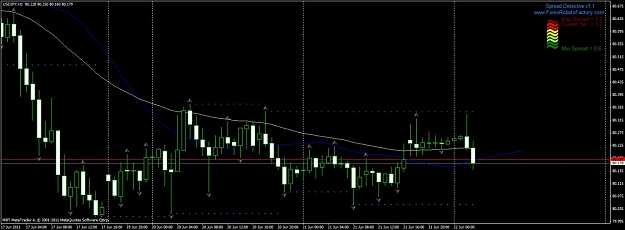
Even if it bounces does the sideways action make you hesitant going long?
Past 11 or 12 candles have been flat is the reason I am asking. Just trying to see what you see. I do see the slight trend upwards but overall its actually been flat longer.
Not a dumb question brother. the previous 11 or 12 candles were little to NO PA. This looks like a break out to me. Price has crossed the 50, the blue line is turning down. Remember, Angle to the blue line is important. I like the angle.
All in all though, the Daily PA is minimal - which would normally tell me to stay away. Will monitor and If I do enter will be with less risk than normal
Ignored
haha I see it. Thanks again. I just learned something. Didn't even see the blue line turning down.
Gonna post it for some other newbies to see it also.
GBPUSD from the 15tf and the 1H confirm a pretty nice cross. Although the pair is range bound between support and resistance might be an opportunity to scalp a few
GBPUSD from the 15tf and the 1H confirm a pretty nice cross. Although the pair is range bound between support and resistance might be an opportunity to scalp a few
Ignored
Do you usually go with trades where pairs are heavily correlated or do you pick one? Just want to hear your thoughts on risk. Again sorry for bombarding you with questions.
This is an interesting point and one I've often discussed. There are many heatmaps out there (some free, some you pay for) which show the strongest and weakest currencies. Logic says you should pair up the two extremes but as we know from experience, the $ for example may be weak against the Euro but not necessarily against some other currencies.
Apologies to Colo if this post is outside the remit of this thread.
Yes I do sometimes use correlating pairs. But the GBPUSD lately has a mind of it`s own. Alot of times correlated pairs don`t correlate around the blue line. If the general trend in both pairs is uniform, I`ll take the trade. If one gives a reversal signal from the blue line, while the other does not, I stay away.
it is not an exact science - you should feel these things out before proceeding
Ignored
Thanks Colo. I appreciate it and have it already in my notes. I like the idea when correlated and going opposite direction to stay away. Makes it crystal clear now using your system. Thanks again.
Goodness - that was FAST. News triggered a drop. Moved stop to +20 pips on both platforms (Oanda and IBFX) both stopped out at +20 pips!
You see? Wasn`t a HUGE victory, but when I COULD lock in pips I did. So what it took me out! - Someone call POLICE cause I just stole 40 pips from a news reaction!