Actually Titch - I've got this morning's high broken!
Ignored
Shit I missed that! It was playing with me until I moved from my station! Maybe I should have another chair on the opposite side of the room with some bino's. lol
Shit I missed that! It was playing with me until I moved from my station! Maybe I should have another chair on the opposite side of the room with some bino's. lol
Ignored
I sent message earlier about an hour ago to watch out for it. if it breaks 1.4338 it will be hanging at 1.44
NZDUSD :Stop at +20
EURGBP: Stop at +20
AUDUSD: Stop at +20
FINALLY! Got in at an opportune time.
All entries were from the 15tf. Will update when I get to my room.
A co-worker of mine (actually a very close friend) that I am coaching, closed his EURUSD trade at +200 pips. I tell him over and OVER and OVER again, do NOT close trades on your own! He gets soooo excited at 200 pips he closes, rather than locking in pips
ROOKIE!
Ignored
By the way, I only trade 90% of my trades eur/usd. today's trades is over 200 pips "round trip I call it" and it is still going up. I am just waiting for it to penetrate the 1.4315 and 1.4338, if it does it will go to 1.44 where there is strong resistance.
I have been following your method for less than a week now and doing quite well. In fact, just closed E$ for 21 pips profit on the 1H time frame. I notice that lately you are using the 15 min time frame. Do you feel this is as accurate as the 1 hour, or are you adding some filtering criteria on the 15 min time frame?
jrushing that is great trading I wish I could get trades like that but with this method I hope I can do better than I have been, I get nervous and close a trade early only to see it skyrocket for heaps more pips what I like about this system is that you dont have to stare at the computer all the time, I start looking for trades just before the hour when the new pip is going to form, place my pending orders, thats it, keep up the good work everybody who is contributing to this thread, everybody seems so positive and helpful
I have been following your method for less than a week now and doing quite well. In fact, just closed E$ for 21 pips profit on the 1H time frame. I notice that lately you are using the 15 min time frame. Do you feel this is as accurate as the 1 hour, or are you adding some filtering criteria on the 15 min time frame?
Thanks, Frank
Ignored
You can trade this on the 15 min tf but I would advise only doing it if you are experienced. As with any trading system they are always more accurate on higher time frames because the higher time frames do not show so much market noise. If you have a look through this thread we do explain a bit about using lower time frames but be careful as you will get more false signals.
You can trade this on the 15 min tf but I would advise only doing it if you are experienced. As with any trading system they are always more accurate on higher time frames because the higher time frames do not show so much market noise. If you have a look through this thread we do explain a bit about using lower time frames but be careful as you will get more false signals.
I hope this helps
Ignored
Hallo
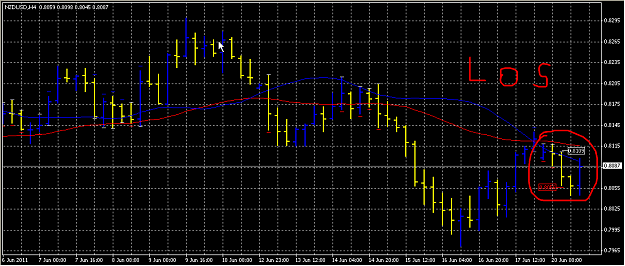
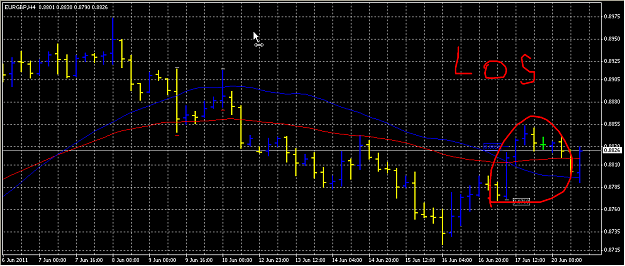
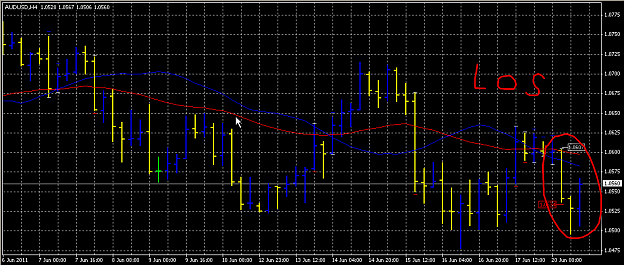
Would one from the trader look to my charts and answere,what is wrong.I have high TF and are 3 losseres.WHY???????????????
Can you confirm which line is the balance line and what each trade is.
Chart 1 Buy or sell
Chart 2 buy or sell
Chart 3 buy or sell
It is really hard to tell from your charts.
Are you also using a 5 decimal point broker. If you are your spread plus buffer also would need to be multiplied by ten giving you a distance from the high or low from around 60 ticks. 6 pips. Also as I said to you before draw S/R levels on your chart as I have a funny feeling you are buying and selling against S/R. Chart 2 is going sideways if you look at both ma's. If you could answer the above questions I would be able to help you better
I was interested in the exits for the system.....looks like it's a one-bar trailing exit, but I didn't see anything confirming that. Can you clarify?
Thanks for your help!
Ignored
Hi RickF
There are no hard rules for exit. Manage the trade the way you would normally manage and exit. I personally use S/R lines for exit points of partial profits and then I move my stop to the previous one or two bars low depending on how much the price is moving. I hope this helps
Can you confirm which line is the balance line and what each trade is.
Chart 1 Buy or sell
Chart 2 buy or sell
Chart 3 buy or sell
It is really hard to tell from your charts.
Are you also using a 5 decimal point broker. If you are your spread plus buffer also would need to be multiplied by ten giving you a distance from the high or low from around 60 ticks. 6 pips. Also as I said to you before draw S/R levels on your chart as I have a funny feeling you are buying and selling against S/R. Chart 2 is going sideways if you look at both ma's. If you...
Ignored
Hallo
No,only 4 decimal.NZD-USD-sell enter 0,8055-exit-0,8082-last bar hight+spread+3 pips.
AUD-USD sell enter-1,0530-exit-1,0551.
EUR_GBP-buy-0,8831-exit-0,8824.