OK Needy, check it out. Technical Analysis is all about Fractal Geometry. Each time frame is just a piece of the next higher Time frame. I know it is confusing but you will pick up on it. For example, if I were to take a short on a Daily Candle my profit target could be the next area of support on a 4 Hour chart. EMA's and MA's are almost the same the only difference is that the EMA puts the most weight on the more recent price action. For example, a 5 Simple Moving Average is just the average of the previous 5 Candles on that 5 Minute Chart. A 13 is the average of the previous 13 5 minute candles.
So similarly on a 1 Hour chart a 5 MA is the average of the last 5 1 Hour candles. So you cannot compare the last 5 5-Minute Candles on the 5 Minute chart to the last 5 1-Hour candles on the hourly chart because on the 5 Minute chart that would be 25 Minutes of Price action as compared to 5 Hours of price action on the 1 Hour Chart.
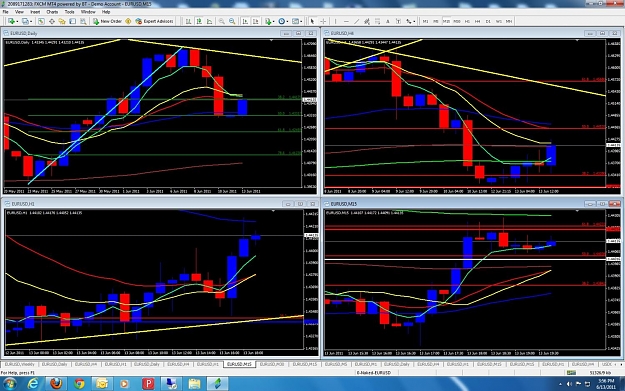
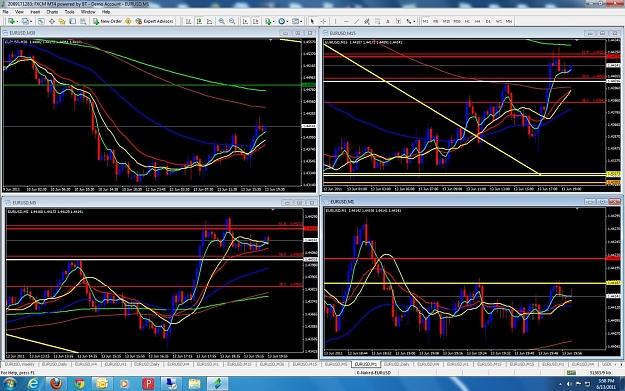
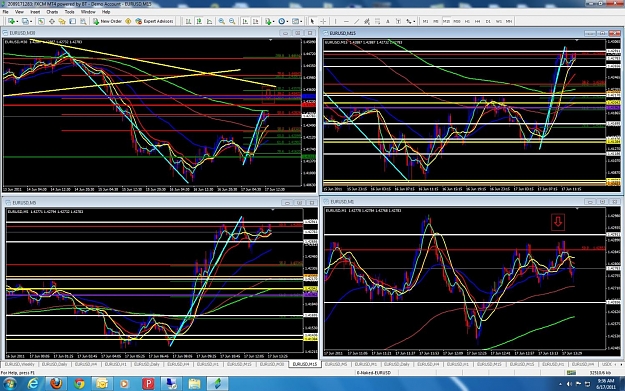
Now, on a 1 Hour Chart price could be up against a 233 Moving Average and at that same time the 15 Minute chart could be up against a 55 Moving Average and on a 5 Minute chart price could be up against a 5 or 13 Moving Average. I know it sounds confusing but it will all come together.
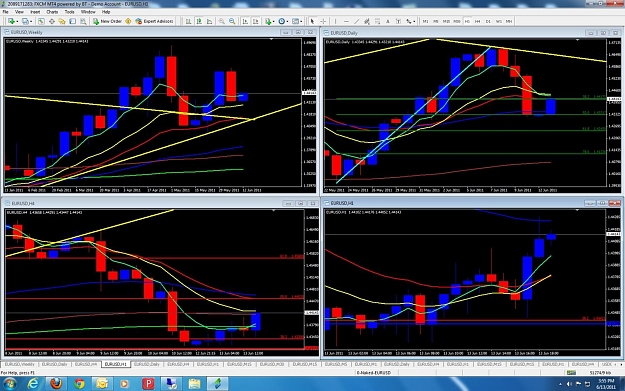
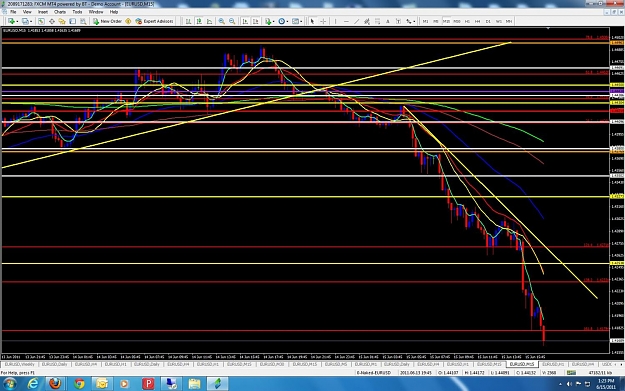
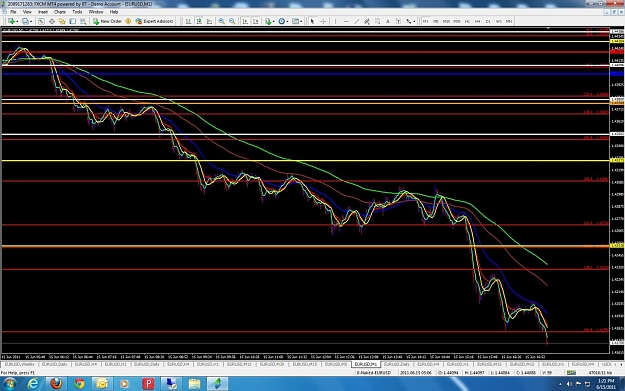
Attached to this message I have provided you with 3 Sets of multiple time frames. This is what I watch for. Compare each time frame to th other and note the various ema's that price is int he vicinity of.
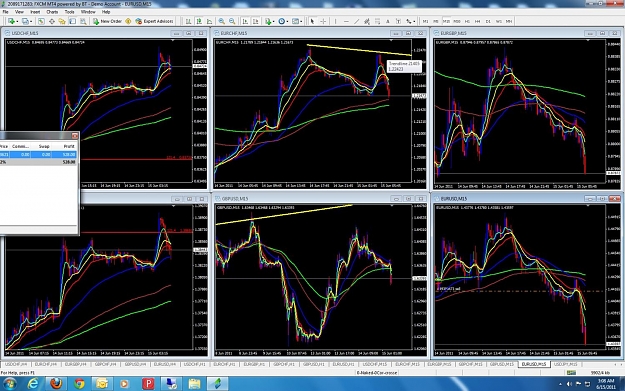
As I have said over and over, I love to trade S/R Overlap/Confluence. I know some traders may be watching the 200 ema (I use the 233) on the 4 Hour to either take profit or say enter a short, and other traders may be watching the 55 ema on the Hourly to do the same and some traders may be watching ema's on the 15 so i try to sync them all together to get into a move of the highest probability.
Also, bare in mind that S & R can be very subjective. On a Daily Chart price can be up against resistance yet on the 4 hour or 1 Hour price can be against support. So, with that being said there are probably bulls and bears at the same price levels. So that is where you either have to wait to see who wins and therefore not be the first one in that trade or be able to determine which will be the winning team. A good example is the game of Tug of war. Both teams may have equal strength members but if one side has one seven members and the other has eight members then more than likely the team with eight members will win.
I hope I have simplified this for you. If not let me know and I will see if I can elaborate further on this.
So similarly on a 1 Hour chart a 5 MA is the average of the last 5 1 Hour candles. So you cannot compare the last 5 5-Minute Candles on the 5 Minute chart to the last 5 1-Hour candles on the hourly chart because on the 5 Minute chart that would be 25 Minutes of Price action as compared to 5 Hours of price action on the 1 Hour Chart.
Now, on a 1 Hour Chart price could be up against a 233 Moving Average and at that same time the 15 Minute chart could be up against a 55 Moving Average and on a 5 Minute chart price could be up against a 5 or 13 Moving Average. I know it sounds confusing but it will all come together.
Attached to this message I have provided you with 3 Sets of multiple time frames. This is what I watch for. Compare each time frame to th other and note the various ema's that price is int he vicinity of.
As I have said over and over, I love to trade S/R Overlap/Confluence. I know some traders may be watching the 200 ema (I use the 233) on the 4 Hour to either take profit or say enter a short, and other traders may be watching the 55 ema on the Hourly to do the same and some traders may be watching ema's on the 15 so i try to sync them all together to get into a move of the highest probability.
Also, bare in mind that S & R can be very subjective. On a Daily Chart price can be up against resistance yet on the 4 hour or 1 Hour price can be against support. So, with that being said there are probably bulls and bears at the same price levels. So that is where you either have to wait to see who wins and therefore not be the first one in that trade or be able to determine which will be the winning team. A good example is the game of Tug of war. Both teams may have equal strength members but if one side has one seven members and the other has eight members then more than likely the team with eight members will win.
I hope I have simplified this for you. If not let me know and I will see if I can elaborate further on this.
Attached Image(s) (click to enlarge)