Hello, i'm a newbie but i love your method, i'll try to follow you and partecipate as i can.
i want just to understand, isn't that a CT trade?
Hello Nino ant thanks for your partecipation!
I see that this your first post and you say you are a newbie so, let me tell you that you are a very lucky (wise) person. Being in a such thread it will help to keep you away of the reasons the 95% of trader are losers for: DREAMS= indicators,EA,etc.
Let's back to our trade!
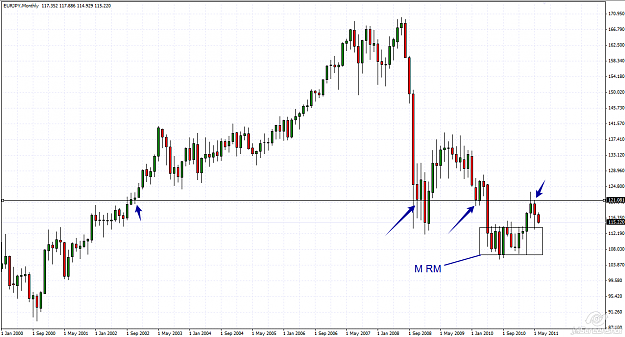
On long trend , yes it's down trend, BUT... the last month closed as a big IPB (IH).That tells me that the buyers are there and are enough strongs.
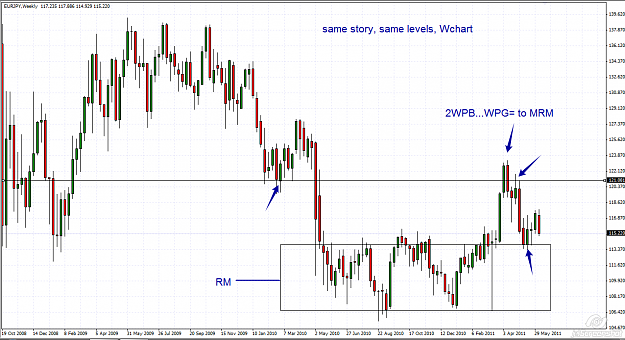
W chart- dblhc= strong buyers. The next bearish candles are loose momentum, with the last one closed as IPB (IH) to S level and this was the first sign that the buyers are loading, but weren't ready to act.
D chart- after a litlle fight betwee buyers and sellers (small consolitation), the buyers take controll with buob (06.08). That was my entry point.
My trade is an obvious proof that READING THE PRICE, everything is possible.
I see that this your first post and you say you are a newbie so, let me tell you that you are a very lucky (wise) person. Being in a such thread it will help to keep you away of the reasons the 95% of trader are losers for: DREAMS= indicators,EA,etc.
Let's back to our trade!
On long trend , yes it's down trend, BUT... the last month closed as a big IPB (IH).That tells me that the buyers are there and are enough strongs.
W chart- dblhc= strong buyers. The next bearish candles...
Ignored
May I tell some things?
In my opinion you are going too fast for the guys who want to learn this method of yours.
Examples:
1) how many know what an IPB is at all?
2) Why don't you post some examples of IPB and the other patterns you use? You are not following other price action standards, so you should explain yours.
3) Could we get easier examples? There are threads spending months before going to harder concepts and we are already showing examples of counter trend trades.
4) Could you post a chart with more visible candles? I can't see yours and my charts candles are all different so I cannot do the exercises and see your DBHLC etc.
In fact I am going to post what I have found in my own charts and it's fairly different.
Here's my USDSEK analysis
This data feed did not produce a pattern, I have put a white square around some ugly BUOB that indeed worked as BUOB.
I want to thank you for making this post! Why? Because your post and my trade show the difference between looking the candles and looking the PRICE!
The most part of traders are looking to a chart and see candles. That's what I'm trying to teach, I'm looking to chart and I see the PRICE= sellers/ buyers!
Ignored
Candles/Bars and Line Graphs are the representation of PRICE ACTION, in a Bear CANDLE the upper wicks show you the Sellers activity and the lower wicks the Buyers activity( a for a Bull ccandle is the reverse meant), so if you look at a CANDLE you´ll see what price i has done in a period of time(this are basics) so I don´t see what´s your point when you make a difference between CANDLES and PA. Would you please elaborate?
I want to thank you for making this post! Why? Because your post and my trade show the difference between looking the candles and looking the PRICE!
The most part of traders are looking to a chart and see candles. That's what I'm trying to teach, I'm looking to chart and I see the PRICE= sellers/ buyers!
Ignored
Do you mean you'd have bought at that price level even if there had been no pattern at all?
I see that this your first post and you say you are a newbie so, let me tell you that you are a very lucky (wise) person. Being in a such thread it will help to keep you away of the reasons the 95% of trader are losers for: DREAMS= indicators,EA,etc.
Let's back to our trade!
On long trend , yes it's down trend, BUT... the last month closed as a big IPB (IH).That tells me that the buyers are there and are enough strongs.
W chart- dblhc= strong buyers. The next bearish...
That's what i understood, in a M chart, after a ripid bear run if we found an IPB(IH) near an S, it's a signal of strong Buyers, So we check W to confirm it.
Please take a look at the eclipse, i saw an IPB(IH) and after a Bear candle a BUOB, but wasn't good enough to enter, maybe it's too far from S and is there too much momentum?
Candles/Bars and Line Graphs are the representation of PRICE ACTION, in a Bear CANDLE the upper wicks show you the Sellers activity and the lower wicks the Buyers activity( a for a Bull ccandle is the reverse meant), so if you look at a CANDLE you´ll see what price i has done in a period of time(this are basics) so I don´t see what´s your point when you make a difference between CANDLES and PA. Would you please elaborate?
You are right Rednose, our charts are the the representation of Price Action, but the difference is only on interpretation and reading the Price.
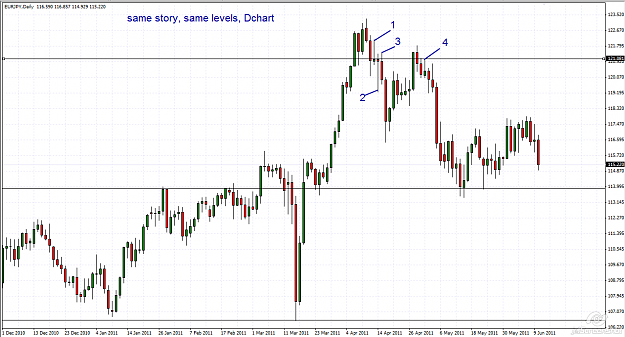
As I said as begining, this methodology is reading the Price beyond cande/bar representations.Let talk on eurjpy chart:
1-PB-the sellers closed bellow ,the buyers are trying to turn the P back, but are rejected by sellers.
2-PB-the buyers's attempt to deffend the level, but are rejected again by selles
3-the sellers finally conquest the level
4-after the sellers turn the P bellow the level, the sellers put a PB as a confirmation that the sellers are in controll .
Note that with 1+2+3 we know at that levels are sellers and the story repeats with candle #4.
The PB 4 is a PB with no size, in traffic, no space, etc ,and many traders wouldn't trade it for these reasons but according to this methodology ,understanding WPD+ knowing that @ that level are sellers, this PB is the best confirmation that sellers are in controll of the level .
For me that is the different between looking to candle and reading the price.
P.S. Note that in this situation 121.08 is far more important than 121RN, and 8 pips could make the difference.
Weekly RMs are making significant Support/ Buyer levels around 91.50, so probably if the market breaks below Daily RM (Descending Triangle), it should trigger further Seller retesting previous RM price taken from W chart
98.13 is a very strong level on my data on all TF.
W are consolidating, the sellers pressure met the trend force and I don't think that would you like to be caught in the middle of this battle.
The safetest entry would be to wait the battle end in order to see who have the controll and than to go with it.
The RM is the fase where the market stay the most part of its time, it is also the fase when most fo the traders are loosing. For those who don't know very well WPD , the safety way to trade the RM is in trend's direction.The RMs requires also a diffrent atitudine with a different MM.
thanks for a great thread, it's really informative to see how price works.
I think the MM money management you're referring to is P is coming up to previous support so it' either going to bounce off, in which case we close any open SELLs, or add to the position if it breaks through and continues down
cheers
Thank you for your contribution!
The PRICE does relly works for the simple fact that that's the market...just PRICE= buyers+sellers...nothing less, nothing more!
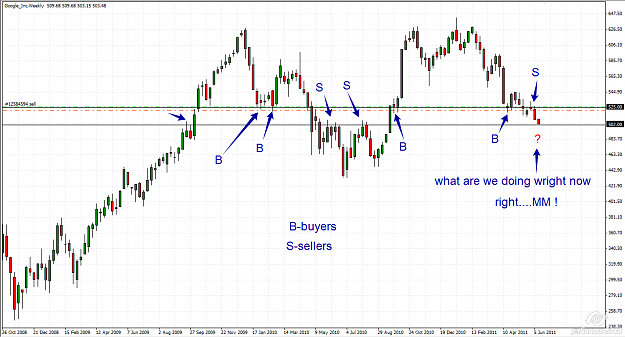
The P reached an important W level,but now we are allready in free trade, so what we are doing?
We are professional traders, so we are waiting the P to show what it wants to do( even if I allready have an idea.....I don't trade ideas, but only the P).
My plan:
If the P finds buyers @ S, I will close the trade.
If the sellers start to fight with buyers,I will tight the SL.
If the sellers will not find buyers, I know where my SL is going.
This is my plan and I will follow my plan=PTT&TTP.
When you want to put a chart,analyses,ask some questions....we are here! Your contribution will be useful for you and for others!