DislikedWhistlepips acceleration in a trend is what u could study in a trend, good stuff!
btw good thread!Ignored
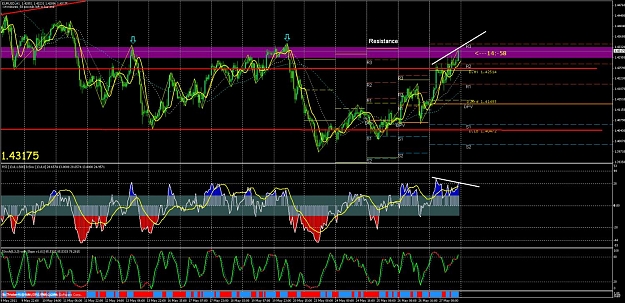
- #2,657
- Edited 4:52am May 29, 2011 3:02am | Edited 4:52am
- Joined May 2007 | Status: Ozziedave | 1,344 Posts
Freebie 1 min trading method 1,227 replies
Naked Trading Using Price Action (No Indicators) 32 replies
Pure Price Action Trading - NO lines or indicators 49 replies
Help adding a filter to the Freebie Indicator 3 replies
EUR/USD Trading Price Action System 2 replies
DislikedHi W no sorry no good links, what i can say is google it!
And checkout the SILVER chart classic example on there.
After an acceleration it drops hard! so look for that dredding signal after a acceleration. cheers and good weekend...Ignored
Dislikedzelden seen such a great 450 pips trend, this week was great! cheers and good weekendIgnored
DislikedMy pivots are weekly pivots inspired by DreddŽs posts on the beginning of the week. There was so much space in between that I decided to add midpivots also. They seem to work preddy good on weekly.
Maybe too early to tell? Been using them only couple of days, but all in all I find weekly pivots predicting PA really good. Ive been using weekly pivots on camarillav9 indi. Check them out if you will.
Added: Thanks for the question I was just thinking do you need them anyway. They do provide some extra entry points, which happen more seldom on larger...Ignored
P
Dislikedweekly results
M +38%
T -11%
W +21%
T +3%
F +12%
Weekly ROC = 63%
With a max RR of 3;1 and a min of 1;1 I never get dispondant if I have losing days
As a day trader we look at weekly profits
Monthly returns
My trading methology
[list][*]Never risk 10pips to get 5 pips ie a negative RR[*]Never add to a losing position to average down[*]Never risk more than 5% of your account on any 1 trade[*]Never 2nd guess the market You dont know where its heading in the next 10mins neither do I[*]Never over analyse your entry ,you get 3 green lights...Ignored
DislikedYes, nice list.
But the big question is "How do you think like an EA for this strategy?"
What checklist (entry criteria) do you use before entering a trade?Ignored
Cheers
P
DislikedWhat I mean by this is dont fuddle the entry by to many what ifs.
An EA would look at the trade like this
For a long
- Have we had a Higher hi
- Is the entry a higher lo or have we had a higher lo
- Is the entry candle breaking up through a pivot and did it close above the pivot
- Or has a pivot just been refused and we are above it
- Did the HA indicator go from red to white on the entry candle
Cheers
PIgnored
DislikedLet's take look at the 1 hr chart of the EU. We've made a nice run up over the last 3-4 days. Now look to the left and you'ii see we're coming into a resistance level. The last 2 times...Ignored