sorry dave forgot to quote you
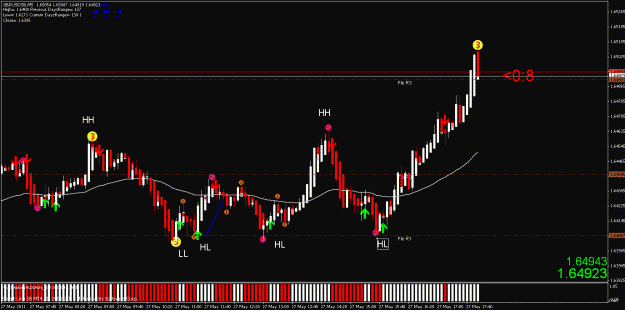
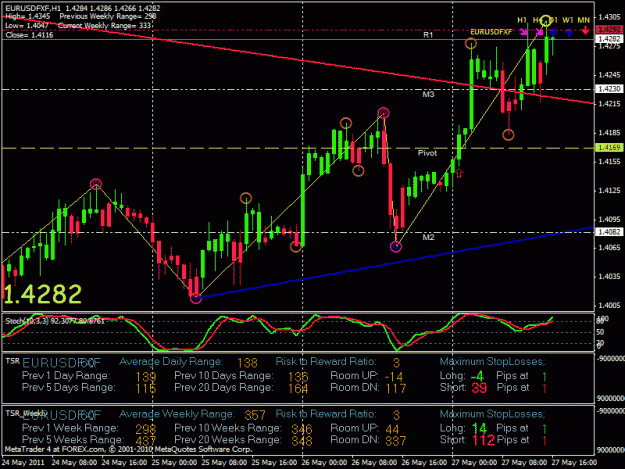
Thanks Dave having a look now, im also seeing that there were some long trades this week off FIB S1/S2/S3 levels.
I will take a closer look at them later but it appears that the FIBs are a bit close together for good R:R if you target the nearest one based upon the candle close price so I guess targers would be at next pvot level or S&R point
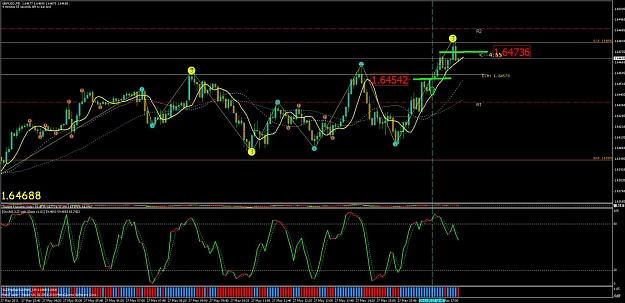
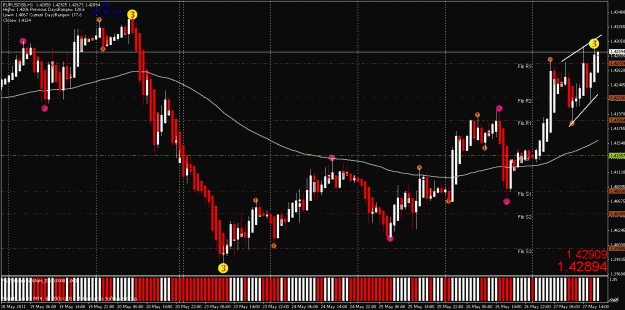
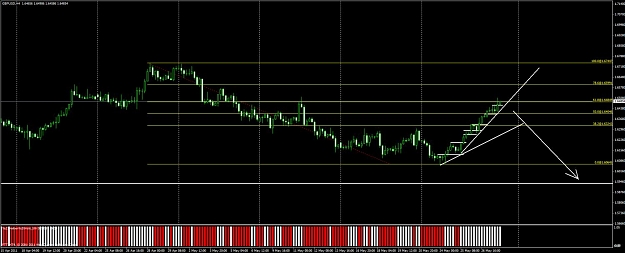
Would you have taken a long here
ST
Thanks Dave having a look now, im also seeing that there were some long trades this week off FIB S1/S2/S3 levels.
I will take a closer look at them later but it appears that the FIBs are a bit close together for good R:R if you target the nearest one based upon the candle close price so I guess targers would be at next pvot level or S&R point
Would you have taken a long here
ST
DislikedHi ST...
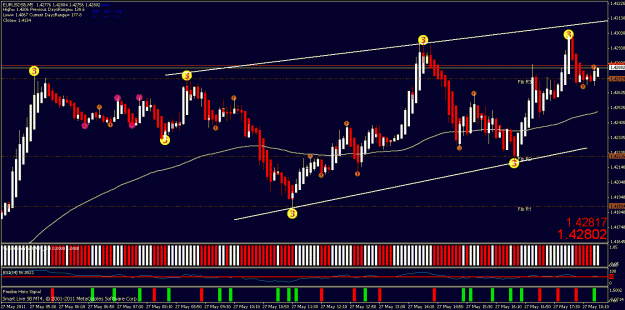
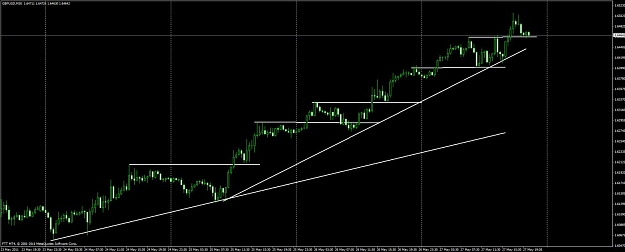
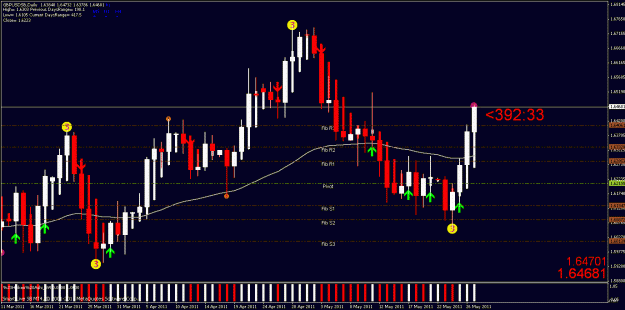
If you are trying out longer TFs then here is a chart to keep an eye on. Daily GU chart. We've made a HH at the end of April and in May we've gone down down to the middle of the month and now we have a nice retracement back up (current swing). On the longer term chart we are overall in an up trend (white arrow). See the green lines, so far this appears to be an A,B,C corrective move. The current swing up is wave B. Now we are getting to critical areas where price might turn around and that is the 50%, 61% and 76% fib retracement lines....Ignored
Attached Image (click to enlarge)
" Dont wait for your boat to come in ..... swim out and meet it"