DislikedHello Evak, me again... i don´t understand... if i ignore the timescale, how i know that it shows what i want... for example in ay-marketprofile DWM v1.31 when i put 0 hour it start at 0 hour drawing the MP... so how can i know that TPO chart is showing what i want...
ThanksIgnored
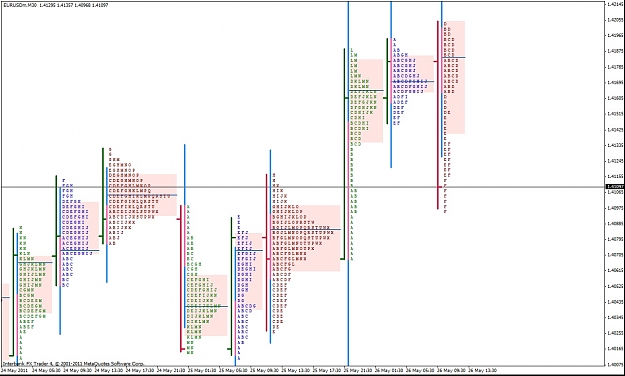
It plots MP histograms ONLY & overlay over the price charts..NOT market profile letters...therefore u can see the MT4 time scaled linear to the charts..the histogram is just an overlay...
If u are plotting letters which are not scaled linearly unless u want to "split" the profiles then that is another story..
In this diagram u have the a normal & split profiles..the split on the RIGHT is like price bars, so that one can be scale linearly like a normal bar charts if u put the time scale on it it should show u the time alignment...unlike the profile on the left..
Attached Image (click to enlarge)
Perhaps a need to understand how profiles are constructed, a primer here would be advisable..
http://www.cisco-futures.com/mpintro.html
http://vimeo.com/5828180