I intend to add a graphic display of the Up 12pips/Down 12 Pips graph as is illustrated in the Excel spread sheet. It will be either an overlay of the chart or maybe in a separate window.
Thanks for sharing your strategy,just a few questions.
Could you go a bit more into how you determine whether you are a buyer or a seller,how you determine short term trend??and how do you determine trend change??
Im sorry if its a stupid question,i'll probably have a few more
TIA
Ignored
No Stupid questions. What would be stupid is trying something without understanding and risking your capital, your inventory on something that you 'hoped' would work. ASK if you are unclear. Unless I'm trapped under something heavy and can't get to the computer or my phone, I'll answer. Deal?
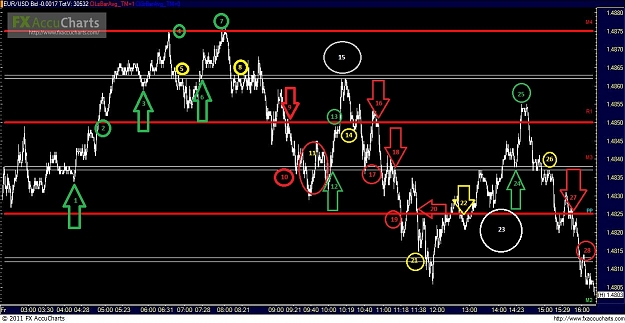
Ok - I've attached a chart, numbered the different spots on it from today and I will walk us through it.
1. Price Action was pretty much in an uptrend prior to that point (couldn't fit it all on the screen...) SO, looking for a spot to buy - it had already gone down and hit 1.4825, but it didn't seem like it would do it again - so the next step up was 1.4837/1.4838. I am looking for 12 PIPS, so my take profit is set at 1.4850.
2. Take profit @ 1.4850. Ok, still a buyer - it hasn't given me any reason to change directions yet, so I'm still looking for longs. My first inclination would @ 1.4850 again - on the retrace, but it failed to come back to it - so order not filled - no trade.
3. Next spot to go long again is @ 1.4862/1.4863. Price came up over it and then back down - Long @ this Price level - looking for 12 PIPS.
4. Take Profit @ 1.4875.
5. Going long again on the retrace back to 1.4862/1.4863. Stopped out.
6. Long again, same spot.
7. Take Profit @ 1.4875.
8. Long Again, Stopped out - OK - This is important - I've been stopped out two out of three times @ this level. I believe the trend is changing. Looking to short now.
A word about Money Management here. If you have been trading long - like we have 1 through 8 so far and now you think the trend may be changing - but you are not sure... What do you do? Well, for me - If I'm not certain - but I want to put on a trade and see - I'll scale down my position size initially, if I'm successful - next trade I'll ramp it back up. If not - no big loss - I put out a little tester - A small trade - it came back no good, but no sweat!
9. Short @ 1.4850, looking for 12 PIPS.
10. Take Profit @ 1.4838.
11. Little bit messy here - tried to go short here twice at 1.4838 - stopped out twice. After second time stopped - right away looking to go long.
12. Long @ 1.4838.
13. Take profit @ 1.4850.
14. Long @ 1.4850 after the retrace. Stopped out.
15. OK - Now, notice how the Price Action tried to long, we had one successful trade (#12), but now we're out again. Price action also failed to reach the levels we saw @ #4 and #7. So - being aware of this, I'm looking to go back to short, however I'm not positive, so I'm going to scale back my position size on the first trade.
16. Short @ 1.4850 (scaled back position)
17. Take Profit @ 1.4838
18. Short @ 1.4838, (full position)
19. Take Profit @ 1.4825
20. Short @ 1.4825
21. Take Profit @ 1.4813
22. Short @ 1.4825, Stopped out.
23. Price Action fails to continue to drop down - now All Price Action is higher than where I was stopped out - Looking for Longs or buying opportunities.
24. Long @ 1.4838
25. Take Profit @ 1.4850. Now also notice - again - we got one long, but no follow through. We failed to even reach the highs of our previous one long. More shorts may be in order.
26. Long @ 1.4838 (Scaled down position) - Just wanted to make sure we weren't going to retry being long. Now on the failure here - if you want to be aggressive - you can reverse field and go short. I don't like to do that - feels too reactive for my tastes.
27. Short @ 1.4825
28. Take Profit @ 1.4813
Changes in trends are tough. But keeping a watchful eye for the clues that Price Action gives you, you can hopefully adjust on the fly and keep rolling along. I know some traders that love 'being long' or love 'being short'. I believe that when I have a bias one way or another - it clouds my vision, and it skews my decision-making. Trade Price Action, wherever it takes you and you should be able to Make Money Everyday, which is of course our goal.
Long post - I hope that helps see some of reasoning behind my thinking. I should be around most of the weekend - anyone has any questions or things to bounce around - let's hatch it out.
Here is an indicator that I developed to test this strategy. It builds a grid according to the strategy and inserts labeled vertical lines where session open and close. Correlation of the session lines to GMT and your broker GMT has to be worked out by YOU. If you can not do this then this indie is not for YOU.
Any questions about repainting or adding alerts will go unanswered.
No Stupid questions. What would be stupid is trying something without understanding and risking your capital, your inventory on something that you 'hoped' would work. ASK if you are unclear. Unless I'm trapped under something heavy and can't get to the computer or my phone, I'll answer. Deal?
I'm still a little confused about the timing of the entries. Take a look at #20 for example:
If I recall correctly you said that you wait for your order to be filled on the retrace to the nearest price level (in this case 1,4825). In the graph it looks like you waited for the retrace to end @ approximately 1,4835 and then got in when it went back down to the 1,4825 level.
If you had your order filled during the retrace it would have hit your 6 Pips stop for EUR/USD before coming back down and hitting the TP.
In other words, do you have your order filled DURING the retrace or AFTER the retrace ended when price comes back to the appropriate level?
I hope you can understand my question as English is not my first language...
I'm still a little confused about the timing of the entries. Take a look at #20 for example:
If I recall correctly you said that you wait for your order to be filled on the retrace to the nearest price level (in this case 1,4825). In the graph it looks like you waited for the retrace to end @ approximately 1,4835 and then got in when it went back down to the 1,4825 level.
If you had your order filled during the retrace it would have hit your 6 Pips stop for EUR/USD before coming back down and hitting the TP.
In other words, do you have...
Ignored
Good question. On that one, # 20, I did happen to wait for the retrace to come back. If I was in at beginning,.I would have been stopped out, you are correct. Lucky that time which I'll take . However I also would have entered again and gotten the trade anyway, it. Just would have had the stop previous added to my days total. Good catch!
Ok, it might be a good system, but no-one can make money every single day.
Ignored
Why can't we make money everyday? I don't hold trades overnight, I keep the unexpected at a minimum... as long as I don't get crazy with leverage and I don't quit trading if I take losses to start the day, then yes, i can make money any day i sit down to trade. I think we make this harder than it has to be sometimes. I know i used to, thats for sure. Whats the saying... if you think you cant, you are right. Thanks for the question!
Ok, it might be a good system, but no-one can make money every single day.
Ignored
Why don't you shut up, sit down and pay attention. This guy is walking you through a way of intraday trading that is simple to understand and is very profitable.
Ok, it might be a good system, but no-one can make money every single day.
Ignored
I had zero losing days this month, it can be done and really isn't that hard to do either.
Stop filling every thread you visit with your garbage, you will never make it in this business, you don't have the right attitude and that cannot be learned, you either have it or you don't.
Hi mongolian,
This is an excellent explanation,thanks.....
What stands out in your explanation to me is,the art of reading price action.If this can be mastered,then as you have shown in your post,you could even have nearly as many losing trades as winners and still come out as a net winner,so long as when you lose you lose less...
That post has re-iterated something that all great traders have echoed to some degree or other,that being,learning to accept losses as part of trading,embracing losses as part of the game,i think a lot of us dont accept a small loss and end up losing more than we initially wanted to lose,i know this has happened to me more times than i care to remember
On reading price action,have you found that tick charts have helped more than say candlestick or line charts?
On trend determination(just bouncing ideas like you said),only buy if above daily open,daily bias,or only buy if above the last hourly open,sell if below last hourly open,hourly bias........dont know just a thought,what would you advise mongolian??
Excellent explanation in simple english any dumb man can understand, my friend Mongolian. Can you help me how to draw those RED lines how on my chart please?
Excellent explanation in simple english any dumb man can understand, my friend Mongolian. Can you help me how to draw those RED lines how on my chart please?
Ignored
Her is my chart how it looks please. Can anyone tell me how to draw those red lines n also other lines at every 12 pips please>
Thanks.
Here is an indicator that I developed to test this strategy. It builds a grid according to the strategy and inserts labeled vertical lines where session open and close. Correlation of the session lines to GMT and your broker GMT has to be worked out by YOU. If you can not do this then this indie is not for YOU.
Any questions about repainting or adding alerts will go unanswered.
Regards, KingHigh
Ignored
Thx for that indi, its great ....but i only get the grid on the lower part ??? Anyone else having this problem and maybe a solution ?? Have to adjust the session times but that is no problem.
Hi mongolian,
This is an excellent explanation,thanks.....
What stands out in your explanation to me is,the art of reading price action.If this can be mastered,then as you have shown in your post,you could even have nearly as many losing trades as winners and still come out as a net winner,so long as when you lose you lose less...
That post has re-iterated something that all great traders have echoed to some degree or other,that being,learning to accept losses as part of trading,embracing losses as part of the game,i think a lot...
Ignored
Thanks for the positive comments. I like tick charts because it takes time out of the equation. The bars only form when the ticks have filled it. Is there a huge difference between using them versus a timed bar, candlestick, whatever - probably not. I just started using the tick charts from the beginning and have continued.
On trend determination - I will post a file later on today after I've added some explanations to it - hopefully it will answer your question about that. Again - Thanks for the comments and the interest.
Her is my chart how it looks please. Can anyone tell me how to draw those red lines n also other lines at every 12 pips please>
Thanks.
Ignored
I don't use Metatrader - so I am not that familiar with it. I imagine that it has some sort of drawing function in it - that's how I use mine - just pick the line function and place it wherever I want. The color you pick is up to you - red was the default on mine - I just left.
Maybe we can get some help from someone who is more familiar with MT4 than I am? Any takers?