I think this trade was a good Vegas 4hr Model trade.
Using this 4hr model it met most all the rules. On the 4hr model the daily chart is used to determine trend direction, only not to trade from.
Might want to read up on that Vegas 4 hr model it has different rules also Dial has an excellent Tutorial on the PF.
There are 3 models, 1hr, 4hr and VWB, which one you decide you would need to follow the rules of that model. Adding in other features like RSI and Harami candle reading is not part of the Model but is not forbiden it is your choice.
Quoting dof
Disliked
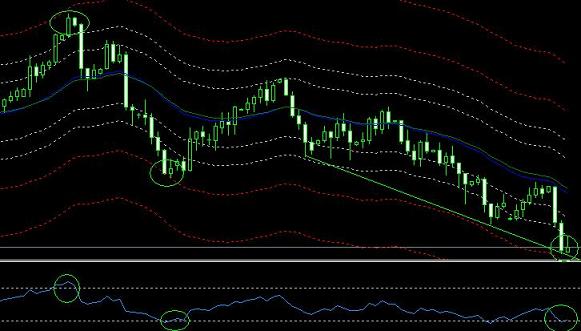
Well... the risk model model is the fib numbers that are projected. I use a indictor wich project all the fib numbers in the risk models and color red the important fib line. In USD / CAD the important one is not the one I took when I put the trade, but the one before and here are my resons:
* price was as the trend line
* price was at that fib line
* harami follow by doji (but doji was a weekend day and that's a minus)
* the RSI just escape from overbought are (was < 30 and then was > 30)
* posible cup & handle forming
Too many signals for the trade to be ignored, in my opinion. It's not the clasical vegas system, but we have to use and adapt, am i rigth?
Here is an updated picture:
Ignored
Nice trade dof..as vegas said vwb is a model and you could customize it which ever way you want and suits you..keep it up and keep us posted also..
I think this trade was a good Vegas 4hr Model trade.
Using this 4hr model it met most all the rules. On the 4hr model the daily chart is used to determine trend direction, only not to trade from.
Might want to read up on that Vegas 4 hr model it has different rules also Dial has an excellent Tutorial on the PF.
There are 3 models, 1hr, 4hr and VWB, which one you decide you would need to follow the rules of that model. Adding in other features like RSI and Harami candle reading is not part of the Model but is not forbiden it is your choice.
Ignored
Well it's a model, not a system. You don't just use it, you implement it first, adapt it and finally you get a system.
I spent a lot of time reaserching on diffrent signal, patterns... candlesticks, rsi, stochastic, adx, bolinger band, they all individually have something, but not enough. I like vegas system, i think it's a great one, but i want to apply what i've read before. It's a long process integrating everything and having a good system, but I hope it worth the time, effort and money
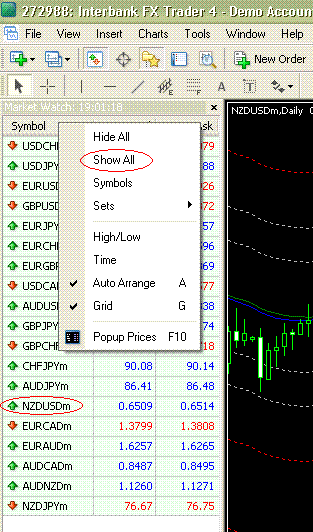
I had this pair (NZD/USD) charted so I could watch it. I noticed since the end of last week that the chart would only display a message saying it was receiving data or waiting for data or something like that.
When I checked the history data on price in MT4 the pair is no longer there. Hmmm...
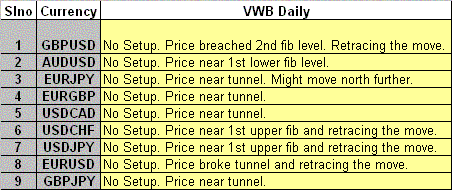
Do the vegas 4h tunel work better than knife 4h? Are the same? What's the differece?
So knife 4h:
A 55 period SMA on the median price.
An 8 period SMA on the close price.
Vegas 4h (1h, the same): Create a 1 hour chart on whatever currency pairs interest you. Barcharts or candlesticks really make no difference. Overlay on this 3 things: 1) a 169 period [1 hour] ema [exponential moving average], 2) a 144 period [1 hour] ema, and finally 3) a 12 period [1hour] ema.
The Metatrader Platform is used by many different companies. I don't think MoneyTec-Demo and MetaQuotes-Demo have NZD/USD. You need to change the server address or download and open another platform to get some currency pairs. As mentioned by Dof InterbankFx-Demo does have NZD/USD. Alpari-Demo has some additional pairs, CFDs, Futures, and stocks at server address: 217.74.44.32:443
The Metatrader Platform is used by many different companies. I don't think MoneyTec-Demo and MetaQuotes-Demo have NZD/USD. You need to change the server address or download and open another platform to get some currency pairs. As mentioned by Dof InterbankFx-Demo does have NZD/USD. Alpari-Demo has some additional pairs, CFDs, Futures, and stocks at server address: 217.74.44.32:443
Ignored
yes..you are right..I use Metaquotes demo and it does not have NZD/USD..will try some other platform..
I modified code from various places and came up with this contraption.
A daily indicator for the upside of the channnel
A daily indicator for the downside of the channel
Each side has fibs 89,144,233,377,610,987
The color of the lines are --- dashed silver lines.
The indicator dectects which currency pair from the list of pairs in the Vegas daily document is being used and plots in red --- lines the area of interest that we are waiting for per the Vegas documents, the extreme fib for that pair is also plotted in __ __ ___ dashed longer red lines. I used the --- lines to try and get the lines in the background and leave the price bars or candles to be more upfront visible as to pay attention to price patterns.
Also a 1 hr indicator was made simular to the above but it has fibs
fibs 34,55,89,144,233,377 instead and 55,89,144,233,377 are in red as they are take profit points if trading the Vegas 1 hour game plan.
I notice that the Price attracts to the fibs even if they are not part of the module for that pair. The silver lines are not part of the module for that pair. These extra fib lines could be used for determining stops, or forcasting where the price might go.
Use at your own risk, and let me know if you see mistakes so I can fix them.
I have not studied MT4 coding yet, but was able to figure out just from looking at sample code, since I do have background in c++ and some others.
Gentlemen, I believe many of us here have the wrong setup on the USDCAD. Although it did show profitability off the 2nd extreme, it shouldn't have even been traded in regards to Vegas's rules. I think were all using Model 1 when we should be using Model 2! That's why we thought it was at the extreme.
I was using model 1 by accident.. I think I may stick to it after seeing what happened couple of days ago LOL.
It may look that way from Dofs charts put if you read post 155 he is using an indicator that uses color coding for the correct fib number for the daily. The chart shows all the fib lines but highlights the fib line that we are waiting for in red example fib 233 for the usdcad which is fib line 3 on his chart and is in red and the ones we are not waiting for are in silver.
The fib lines start at 89 and go to 987 for all the daily charts, interesting thing is it is very obvious how dam accurate the prices hit almost every fib line even if it is not part of the model. It just goes to show Vegas is really on to something here. I noticed tunnel line 144 is not used in the original vegas program if that is truely the case I could add another fib line perhaps fib 55 just to see how accurately the prices hit it. MT4 only allows 8 indicators per program.
With this indicator you do not have to figure out which model to use the program figures that out. Just insert the indicator for the up fib lines then insert the indicator for the down fib lines and it sees which currency pair you are using and highlights the lines of interest in red.
Another thing is over time the fib lines of interest could change as dynamics of the currency world change and this showing of all the fib lines would trip you up to the fact the the line of interest is no longer it or something like that just a thought.
Quoting xspowerx
Disliked
Gentlemen, I believe many of us here have the wrong setup on the USDCAD. Although it did show profitability off the 2nd extreme, it shouldn't have even been traded in regards to Vegas's rules. I think were all using Model 1 when we should be using Model 2! That's why we thought it was at the extreme.
I was using model 1 by accident.. I think I may stick to it after seeing what happened couple of days ago LOL.
Also DOF was not trading according to Vegas rules he was just trying out something called a Cup and a Handle and a Harami Candle formation he knew he was not at the Vegas daily fib lines.
Quoting lambrechtj
Disliked
It may look that way from Dofs charts put if you read post 155 he is using an indicator that uses color coding for the correct fib number for the daily. The chart shows all the fib lines but highlights the fib line that we are waiting for in red example fib 233 for the usdcad which is fib line 3 on his chart and is in red and the ones we are not waiting for are in silver.
The fib lines start at 89 and go to 987 for all the daily charts, interesting thing is it is very obvious how dam accurate the prices hit almost every fib line even if it is not part of the model. It just goes to show Vegas is really on to something here. I noticed tunnel line 144 is not used in the original vegas program if that is truely the case I could add another fib line perhaps fib 55 just to see how accurately the prices hit it. MT4 only allows 8 indicators per program.
With this indicator you do not have to figure out which model to use the program figures that out. Just insert the indicator for the up fib lines then insert the indicator for the down fib lines and it sees which currency pair you are using and highlights the lines of interest in red.
Another thing is over time the fib lines of interest could change as dynamics of the currency world change and this showing of all the fib lines would trip you up to the fact the the line of interest is no longer it or something like that just a thought.