HI KG what are those labeled levels on the right edge? + 1 + 2 so on?
I have weak eyes...bro..turn up the lights a little..
Ignored
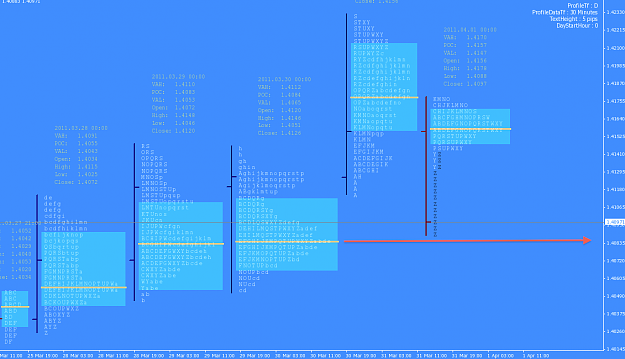
Level on the right are last 24 hrs SMA and Standard Deviation only (Mean and Standard deviation). And The green line is last 24 hrs Median. the purple line is 120 hrs Median.
Actually, i use MP as a Mode only and combine it with Means and Median to help me read and understand the price movements. There are a correlation between Mode, Means and Median in data distributions. http://en.wikipedia.org/wiki/Skewness
KG
Ignored
ah ok...reversion to mean trading..
tks for the wiki post to..reminds me of the time in University which I can still recall my thesis on statistical outliers...haha
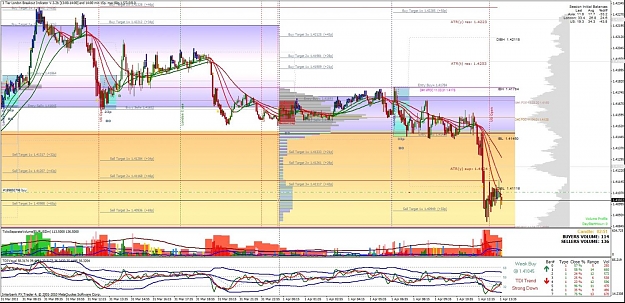
KG if you dont mind I give you my opinion about those "Pockets". As I saw at a yt video a guy said that those levels are either quick cross areas or strong rejection ones. In the present on EU we have several tests of the 1.4148 Pocket. Combining that fact with the method of S/D from the thread "Price is everything" here @ ff I can understand that as a consumption of that level meaning we should go South in a strong way in a few moments. Maybe Im wrong but is just my opinion.
Ill keep learnig from you guys!
ps. the screenshot is from a setup you posted some hours ago
I take a week off to visit the UK and come back to find 25 pages packed with great posts from members old and new(er), new indies - special thanks to Bandung.....again...........links to other areas for research etc etc......much to consider and then to work out how to adapt for my use / style......lol, the "work in progress" file keeps growing......thanks guys
KG if you dont mind I give you my opinion about those "Pockets". As I saw at a yt video a guy said that those levels are either quick cross areas or strong rejection ones. In the present on EU we have several tests of the 1.4148 Pocket. Combining that fact with the method of S/D from the thread "Price is everything" here @ ff I can understand that as a consumption of that level meaning we should go South in a strong way in a few moments. Maybe Im wrong but is just my opinion....
Ignored
Thanks booster for the info.
Your screenshot looks familiar
|
Joined May 2010
|
Status: Day by Day
|1,004 Posts
long at 1.4094. I was targeting 4084 as the entry (tues/Wed naked POC) but gave some breathing room of 10 pips to account for broker spread manipulation during big news events.
at the moment it looks like EU bounced right off the POC.
Amongst the pair I was monitoring...EJ is the only one that makes sense to me as it clearly show initiatives with a clear open-drive...
Took a long just above IBH...initial risk was 20pips.. since then out with +51pips. Lucky trade since EJ did not exhibit any adverse movement on release of NFP
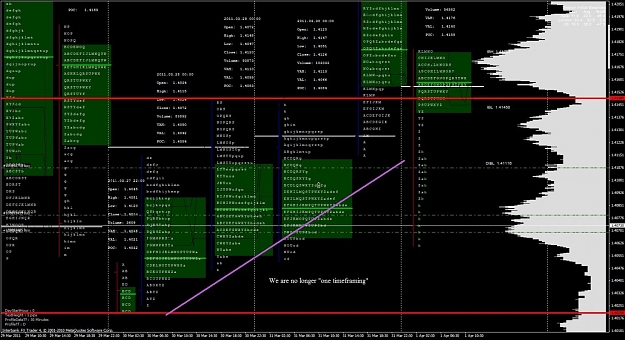
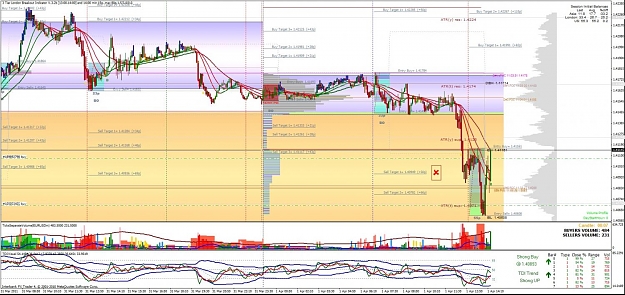
I just took a few longs. To be honest I entered @1.4176. It started to go against me and start to fall. On the way down I added 2 small longs. Only because US is opening and there should be a shift in inventory balance. Instead of 1 lot I broke it into 3 smaller ones, so I can reduce my risk by closing the smaller lot at profit, or where need be. It looks scarey as hell if your looking at a standard chart. But with the profile not scary at all. One big P formamation. Lets seee how it goes.
Attached Image(s) (click to enlarge)
Markets are not efficient, rather they are effective - Jones
Sorry Forgot to update photo after I added to my position.
Ignored
still in my long...pending hedge further below just in case. agree with you, scary as hell watching the price drop, but the profiles are still bullish and in an uptrend so being patient. However, unlike you, i did not enter another long near 4060...was thinking about it, but didn't pull the trigger...emotions again
Question...you're using my IB indicator, but your values for IBH/IBL and hence extensions do not match up with mine...and yours look a whole lot more accurate. What times are you using for Tokyo/London/NY start?
I just took a few longs. To be honest I entered @1.4176. It started to go against me and start to fall. On the way down I added 2 small longs. Only because US is opening and there should be a shift in inventory balance. Instead of 1 lot I broke it into 3 smaller ones, so I can reduce my risk by closing the smaller lot at profit, or where need be. It looks scarey as hell if your looking at a standard chart. But with the profile not scary at all. One big P formamation. Lets seee how it goes.
Ignored
Yeah, no more one time framing...& watching the profile don't look scary, instead it exudes confidence in you... Like your trade girl...
I took a different route on buy limit on GU instead via VSA trigger level..entry was set to 5980..& look at GU's profile with GMT set to NY session makes me wonder, the hell with stop loss...haha
still in my long...pending hedge further below just in case. agree with you, scary as hell watching the price drop, but the profiles are still bullish and in an uptrend so being patient. However, unlike you, i did not enter another long near 4060...was thinking about it, but didn't pull the trigger...emotions again
Question...you're using my IB indicator, but your values for IBH/IBL and hence extensions do not match up with mine...and yours look a Whole lot more accurate. What times are you using for Tokyo/London/NY start?
Ignored
I noticed that too. The indi. agrees eary in session then it shifts. 0gmt for asia, 7gmt for uk I like the franfurt open, and 13gmt for US. The indi. I found here at FF. used for morning range break out levels. I just change it for my 1 1/2 x, 2x, 3x IB range. Maybe you can use some of the code. Its a great piece of work. Take a look. It is not the original indi, I altered it somewhat, to suit my needs. I just dont like that I have to have 3 instances of the same indicator. But I set it for each session.
Just to get a consensus on the crash of mptext indi...
I am suffering from bout of crashes & funny thing is when NFP started just now when u see those scrabbles doing the dance..it crash 5 seconds into the news...haha
Just trying to minimise the crashes with maybe using another mt4 platform besides my IbFX as i still love this indi to death..
can u guys let me know your broker platform u chart with mptext & frequency of crashes if any (some lucky felllow if any ) & what the last thing u did b4 it crashes e.g. chging timeframe, chg of parameters..loading a pair so on..
tks if u care to respond..
& yes my problem is all of the above & i have to reboot my IBFX 20 over times a day...haha
Just to get a consensus on the crash of mptext indi...
I am suffering from bout of crashes & funny thing is when NFP started just now when u see those scrabbles doing the dance..it crash 5 seconds into the news...haha
Just trying to minimise the crashes with maybe using another mt4 platform besides my OBFX as i still love this indi to death..
can u guys let me know your broker platform u chart with mptext & frequency of crashes if any (some lucky felllow if any ) & what the last thing u did b4 it crashes e.g. chging timeframe, chg...
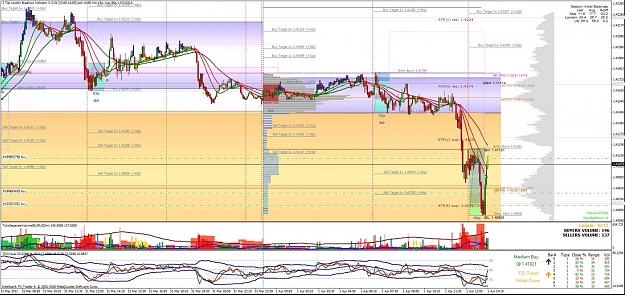
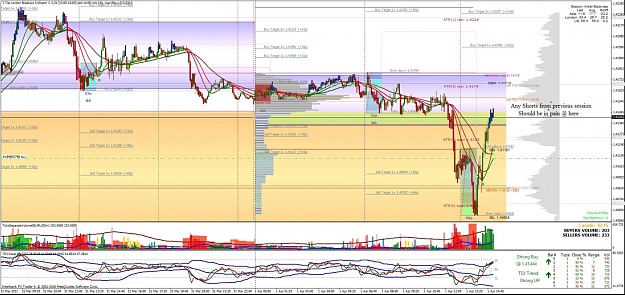
Took profit left one trade on the table. But if the shorts are being squeezed, this is as far as you can squeeze, before they all start to get stopped out or Bail.
Attached Image (click to enlarge)
Markets are not efficient, rather they are effective - Jones