Hi all,
I can see a clear case of a dearth of buyers on GU 30min tf.
I suggest taking a short at the close of this 30min bar and TP @ 1.6010
Bar already ended.
Ignored
I exited my sell trade.
Now pending short at 1.6077
Happy trading!
Do you imply need to see price going up? That is more demand that supply?
Ignored
Let's say a down bar with average spread has huge volume compared to previous and the next bar closes up. That means there were buyers present. To have huge volume and not move very much is an indication that a counter move could happen.
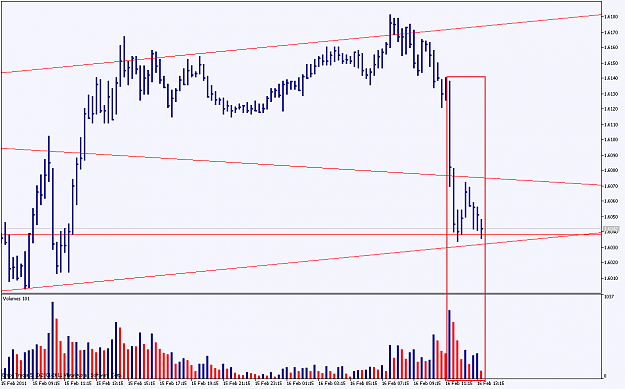
GU today wouldn't really fit the description as the spread is wide and so the volume is very high. This is selling. Even the next bar is down. But what is interesting is that the spread is narrowing and volume is less. This might not indicate buying but the selling pressure is lessening.
The third down bar made almost no progress to the downside and is not quite low volume compared to previous bars. And it just so happens that we approached channel bottom.
Next bar is up but volume is very low. That tells me there's little interest to the upside at this moment OR sellers just aren't interested. Next bar is again up but the volume is higher while the spread remains almost the same. This raises suspicion that maybe there's still supply present. Next bar closes down but volume is very low and in fact lowest during this move. To me that is no supply or testing to see whether there are still sellers present.
I'm not really a pure VSA trader so I call no supply and tests in VSA tests.
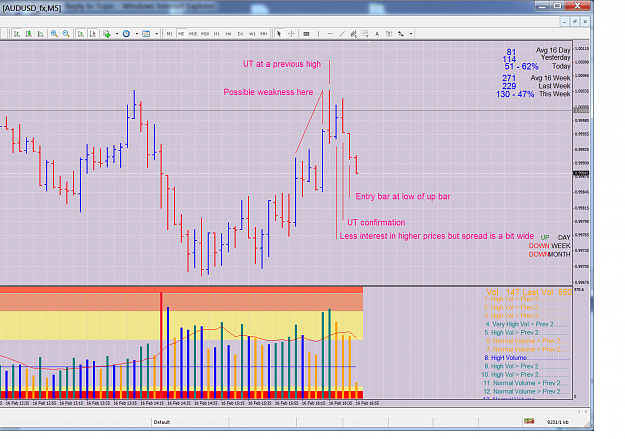
Now the next bars while they are down bars, volume is higher than the previous test bar with closes near the highs. This to me indicates that sellers didn't do anything and are not interested to sell at this level and buyers should be coming in.
As for how I'd like to see demand manifest itself is wider spreads to the upside on ascending but not extreme volume. Entry on a low volume down bar with next bar being up. So a stop below the low volume bar and entry just above it. So far I haven't seen demand.
Having said all that I'm looking more at 1h or 4h timeframe these days to judge the market as I got a bit burned out from lower TFs.
Also VSA doesn't teach to catch falling knives as some seem to think. On the contrary, it teaches how to find the safest possible entries and avoid chasing the market. While you give a portion of profits away this way, you get safest entries in return. Advanced traders may attempt to bottom or top pick once in a while but that is because they are disciplined and have been in the markets for a long time.
I don't get it. Weakness is still very much out there, but price action look like a weirdo, normally, price would have rocket downwards. Guess it's not ready yet. Move SL to BE.
Edit 1 hour later: Thank Intel, it rockets up like mad later hit SL @ BE. Happy
Ignored
Well done, I'm glad you didn't lose on the trade. A good example of trading what you see NOT what you expect.
Well done, I'm glad you didn't lose on the trade. A good example of trading what you see NOT what you expect.
Ignored
Well, sorry Intel, I let you down, just made a loose trade on Cable as I expect it goes up after seeing stopping volume..
Quoting Intel
Disliked
Certainly very useful to know where the volume came in. I turn to the M1 chart to find out myself.
Ignored
Very good point, I think I've learnt something, Intel. This certainly can be used to scale out possible trade in small consolidation period in 5m after stopping volume. Is it?
Well, sorry Intel, I let you down, just made a loose trade on Cable as I expect it goes up after seeing stopping volume..
Very good point, I think I've learnt something, Intel. This certainly can be used to scale out possible trade in small consolidation period in 5m after stopping volume. Is it?
Ignored
How you use the levels is a personal thing. The importance is in the knowing they are there.
It's contingent on how you're filtering time data. Applying RBs to tick data or second fractions can reduce the noise ratio and false signals common on a raw 1M.
Ignored
Anything that can improve your accuracy when determining these areas is always helpfull. I use M1 because I know what I'm doing with it and am happy with the results I get from it. If I were having problems in this area, I certainly wouldn't rule out RBs.
Let's say a down bar with average spread has huge volume compared to previous and the next bar closes up. That means there were buyers present. To have huge volume and not move very much is an indication that a counter move could happen.
GU today wouldn't really fit the description as the spread is wide and so the volume is very high. This is selling. Even the next bar is down. But what is interesting is that the spread is narrowing and volume is less. This might not indicate buying but the selling pressure is lessening.
|
Joined Jan 2009
|
Status: Fading the specs
|1,374 Posts
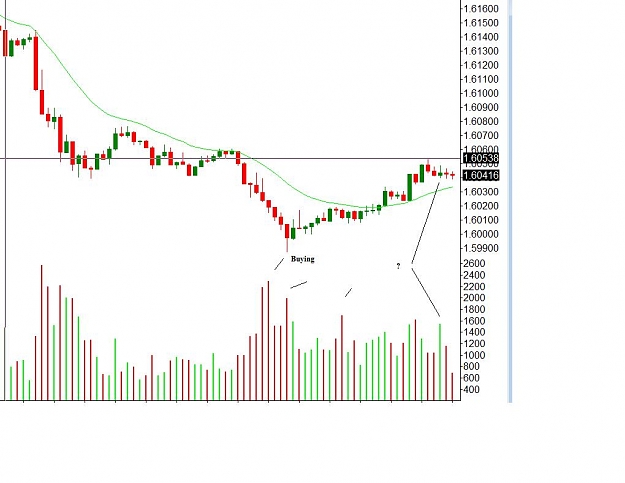
The Gu was bought again off of 6000 making for a wild day. I am still very bullish on GU and think we may have seen a sucker drop on the pair. The chart posted is 5 min and I very much like a break of 6055 for a long entry. I will be watching this like a hawk, much like traders expecting hawkish comment from certain bankers last night on GU. The ? mark is not for wtf, its meant for are you showing us your hand that easy. We shall see, FOMC minutes later still.