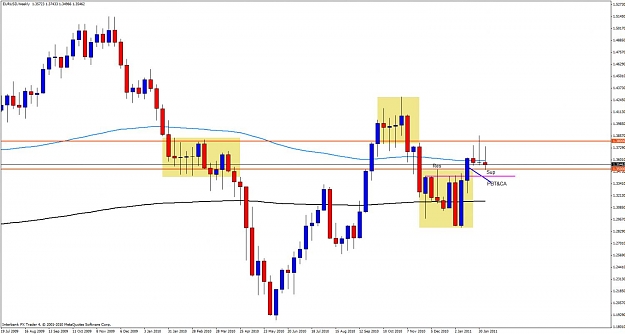
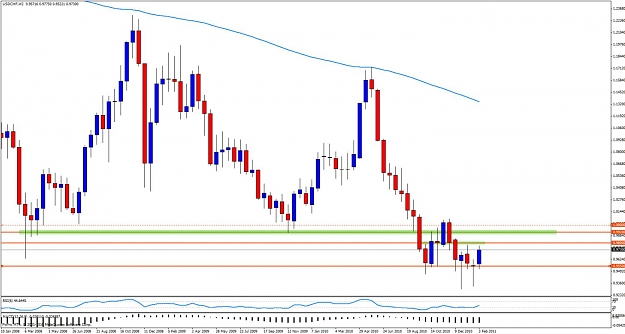
DislikedWhen we have a PA candle on M chart,its effect on lower tf is at least a consolidation,in our case is M-IPB,witch worked fine,making a sideways(SDW) market (yellow consolidation) on W.The 2WPB pushed the price up and closed above SDW's limit and blue ppz.It is true that the friday candle closed in the WPB's(2011.01.09) range and below 0.98 R,but if we see bullish PA as my chart,I belive that 0.9920 will be the next target.
P.S.Except the parity,0.9920 was the most important S on M chart and was never confirmed as R(just mine about market structure/dynamic)....Ignored
I see your point fxg. The .9920ish is a great level and if Price can cut through th .9800 without much reaction (relatively speaking of course) we could go beyond the .99 to the 1.0. But the .9800 is going to have its say . .imo.
Nice work ..
Attached Image (click to enlarge)
Indicators show the past. Price Action "Indicates" the future.