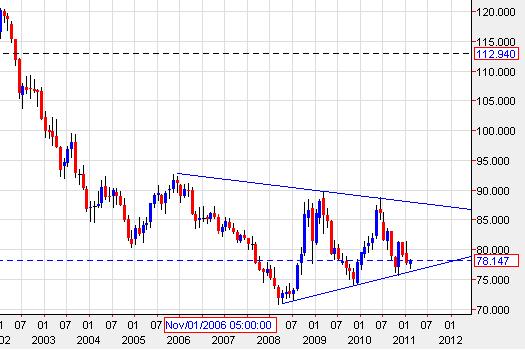
I have uploaded the monthly chart of the Dollar Index for a long term perspective. Also to start to get accustomed to longer term position trading charts
We appear to have bounced off the lower trend line in a triangle.
This triangle is contracting and angled upwards.
The next target for price - assuming it doesn't misbehave is the upper trend line around 87. It is not likely to be in a day though as this is a monthly chart.
We are being given the opportunity to get in earlier now so that tour stops can be small and managable. How would this chart look at the end of march, or April?
If this plays out correctly then expect a eurusd collapse and a period of us$ strength. If we break out beyond the top trend line then something political or financial has happened imho
Olu
Attached Image
If you think you can or cannot do it you are correct