looks like today's POC is going to be around 1.3633. one lower POC does not change a trend...keeping the faith
Ignored
Nope but closing back below that 61.8 fib level at 3742 doesn't help the bulls much. If we get back below the 50 fib at 3577 and we may have a whole other story... Hopefully after NFP we will get some clarity on the direction the big boys want to take this pair.
Nope but closing back below that 61.8 fib level at 3742 doesn't help the bulls much. If we get back below the 50 fib at 3577 and we may have a whole other story... Hopefully after NFP we will get some clarity on the direction the big boys want to take this pair.
Ignored
Not sure if you guys are trading Tokyo but we've got a POC from 1/24 below us in the middle of a 4h demand zone, and above us is a trigger line that feels far away.
Here is some good music to pass the time while we wait
Not sure if you guys are trading Tokyo but we've got a POC from 1/24 below us in the middle of a 4h demand zone, and above us is a trigger line that feels far away.
Here is some good music to pass the time while we wait
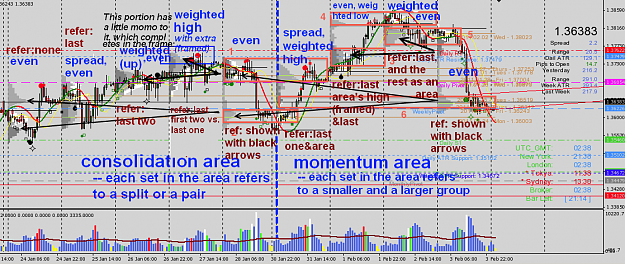
After lurking for several months on the VSA thread - getting my head around volume,thanks to all the great traders there for opening my mind and showing me the light. I have decided to post my first reply here as i have been playing around with market profile intuitively for some time now
but was not sure i was going in the right direction.This is a trade i was watching develope over 24 hrs,due to a oversleep(gmt) i missed my inital entry at the failure of 38321 but i did manage an agressive entry below my second take profit line and failure of S1.My take profit was as you can see the red line above the dark grey box at 37198.As we know from todays price action,due to options expiry (must pay more attention )the price shot right through my target area,but it was a very quick 34 pips so i am not complaining.The snap shot is from my live MIG account,i am suspect of there volumes - as i have just opened a demo MT 4 (beta)account with Dukas copy and there is a signifcant difference in volume.Dukas copy is very close to my Broco futures volume...Hmmm.
Thanks for all the usefull info posted here - it will keep me busy for some time.
|
Joined May 2010
|
Status: Day by Day
|1,004 Posts
I'm still learning market structure, so this may be completely off, but here's a theory based on the definition of a double distribution day. First an extract from market profile basics
"It is important to watch the Tpos here between the two distributions. They are usually single prints, but if you notice them changing to double prints later during the trading day, it is an indication that price levels are not being sustained at the second distribution; they are, in fact, moving back to the first distribution."
Since MT4 doesn't let me merge days, imagine the boxes represent merged value areas.
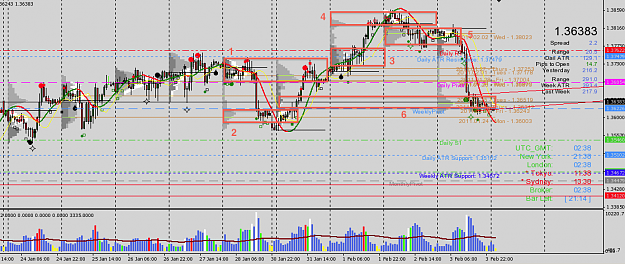
Friday and Monday were both double distribution days, represented by boxes 1 & 2.
Tuesday EU builds value higher with box 3, but also forms a double distribution day with a small value area at the top. Wednesday fills in the top value area (box 4), but also fills in the gap between Tuesday's top (box 4) and bottom value (box 3) areas, which by definition is an indication price is moving back to the first value area marked by box 3. However rather than returning to box 3 today, price slide right down to an area where little value has been established, between boxes 1 and 2.
So what does that all mean? if we extrapolate the basic market profile premise of a double distribution, EU was establishing value at #1 and then #2, but if TPOS start to fill in the single print areas (box 6) (or put another way, if value starts to build in the void) then price is not being sustained at #2 and are moving back to #1. And if we merge boxes 1-5, that could mean EU is heading back up and could possibly do so quickly as value has been established at the levels in between boxes 1-5.
That's one theory supporting the bullish view, which i'll admit i'm biased towards as today looks a lot like last Friday. I'm going to try and come up with a bearish theory as well if i can.
|
Joined May 2010
|
Status: Day by Day
|1,004 Posts
ok, as per the previous post, here is now a bear theory using market structure.
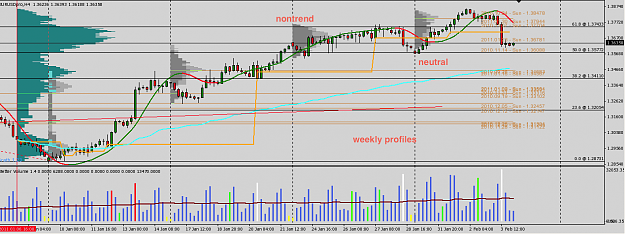
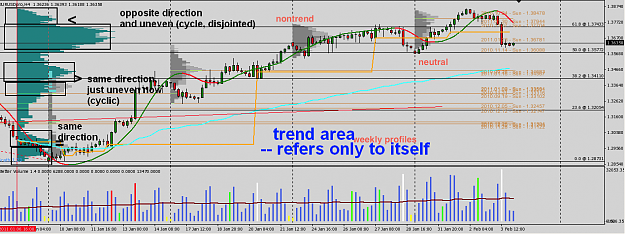
There are several different structures of the market, trend day, double distribution, non trend and neutral. The H4 chart shows the weekly profiles for EU plus the profile since the start of 2011 in green on the left.
Last week could be classified as a nontrend structure. Per the definition (see previous post for link), a nontrend profile has a narrow range and wide profile with little-to-none range extension. A nontrend structure is usually followed by a change in trend (according to the definition). Interestingly enough nontrend profiles often occur before major news events (aka NFP)
This week could be classified as a neutral structure. This structure implies balance between supply and demand in that range. Where this structure closes is the key. Balance is in achieved if it closes in/near the middle, but if it closes at or near the top or bottom is signals either the bulls (closing at the top) or bears (closing at the bottom) are in control.
So, on a larger timeframe, the structure is telling us that we may be in the midst of a trend change but that tomorrow's close will be the deciding factor.
Tomorrow will be the key, but given this theory is on a higher TF, i have to give it more weight and therefore proceeding with extreme caution.
Joined Aug 2009
|
Status: Reading the TAPE
|2,389 Posts
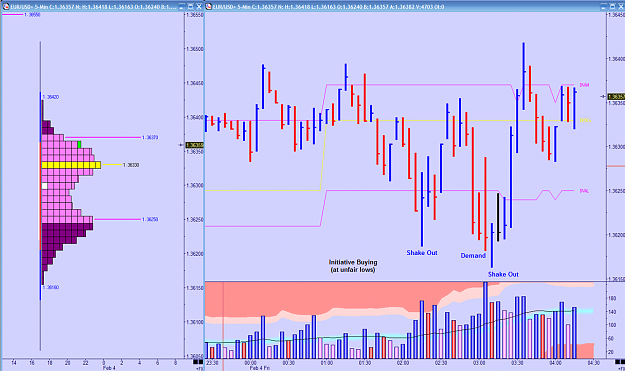
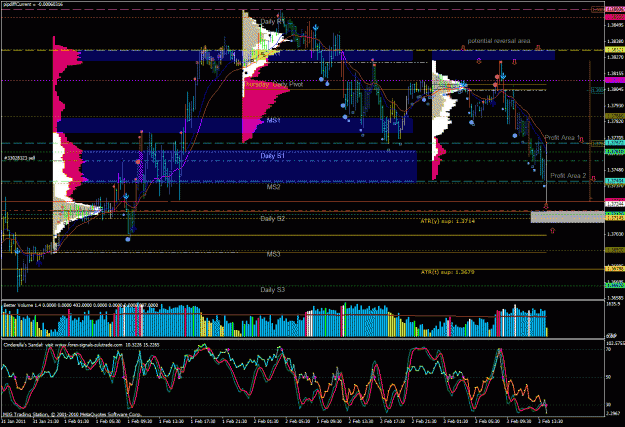
Just a quick pic of what Initiative buying looks like. If we get buying as price brakes the top of the Developing Value Area then it would be Responsive buying.
Attached Image (click to enlarge)
Without VSA, you're playing checkers while the Smart Money plays chess.
I'm still learning market structure, so this may be completely off, but here's a theory based on the definition of a double distribution day. ...
Ignored
Hello tgwhbb,
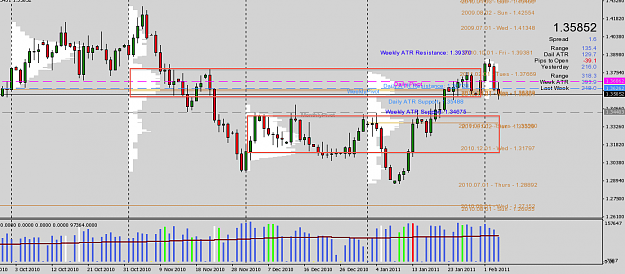
interesting analysis that is. I would like to add, even though you mentioned it somewhat, that in order for this scenario to take place, the area between roughly 1,3669 and 1,3655 needs to be cleared. It seems to me like it could pose a significant obstacle, since on a merged MP from 28 Jan until today the area looks a bit "single printish".
And to advance the bearish case, doesn't it look odd that yesterday's giant hourly candle cut through five POCs (01/26, 01/27, 01/28, 01/31, 02/01) with relative ease?
doesn't it look odd that yesterday's giant hourly candle cut through five POCs (01/26, 01/27, 01/28, 01/31, 02/01) with relative ease?
Ignored
i'm not sure what to make of cutting through all those POCs quickly from a structure point of view, but the market does not like those type of wide spread, ultra high volume bars. This is where VSA comes in to help on the analysis.
Today's developing POC is lower than yesterday's, making lower POCs since Wednesday. BUT, today's developing structure is so far a nontrend day, which as mentioned in the previous post dictates a trend change, and the hourly trend has been down, which means it should go up.
This is also confirmed with today's price action. We are seeing initiative buying as HG points out at the bottom with increasing volume, while at the top of today's structure we are seeing initiative selling but with decreasing volume. So bit by bit the demand is removing the supply and overcoming it.
So, with all that my bias for today is up. My longer term bias will depend on today's result. With NFP in 1 hour, today is the type of day many people loose money as stops will be hunted in both directions so expect large swings at NFP. I'm expecting a raise so looking for a buy at the unfair lows of today's developing POC, but will take a very small position size to minimize risk.
So, with all that my bias for today is up. My longer term bias will depend on today's result. With NFP in 1 hour, today is the type of day many people loose money as stops will be hunted in both directions so expect large swings at NFP. I'm expecting a raise so looking for a buy at the unfair lows of today's developing POC, but will take a very small position size to minimize risk.
Ignored
update: my bias changed just before the NFP with the 13:35 GMT bar. it looks like a EORM type bar. I closed by buy limit that i had further below in unfair lows. on the side lines for now, doesn't look like i'll be trading today, which is probably for the best.
|
Joined May 2010
|
Status: Day by Day
|1,004 Posts
market structure is becoming much more interesting as i learn more about it.
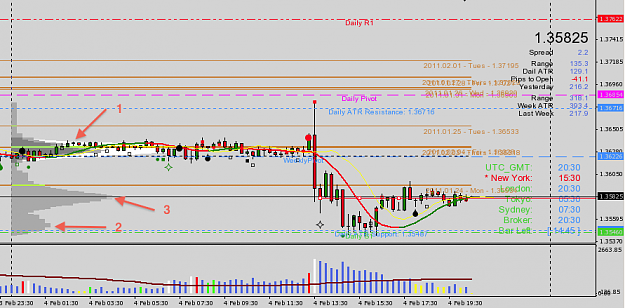
The first chart is EU 15 for today. There are 3 volume nodes, and the sequence of when the nodes were developed are indicated. At first EU looked to be creating a nontrend profile as indicated earlier (node 1). Then it dropped and started forming node 2 - the making of a double distribution profile. Then the interesting thing happened, and it filled in the "single print" area in between and formed node 3. With less than 1 hour left in the day the structure probably won't change and we'll likely end up closing on node 3's POC.
when a double distribution starts filling single prints, price will generally move back to the first node, so in this case up. That said however, today's POC will be roughly 3 pips lower than yesterday's, making that 2 consecutive lower POCs. I believe the theory is 3 consecutive balance changes indicates a trend change - i need to research this more in the weekend.
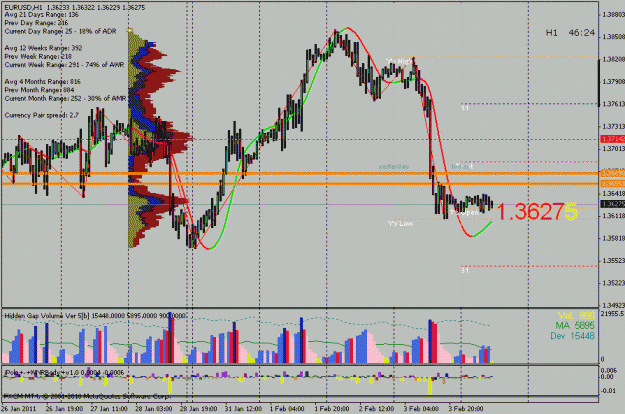
the 2nd chart is EU daily where we see it is at the value area low of the current value area established in october and reconfirmed in january and it looks like we'll hold that value area for today. Add VSA into the mix and today is a low volume test of the January 19 breakout of the last value area as we came to within 5 pips of the high of January 19.
It seems like i've been flip flopping around today on my bias, but i guess that's a good thing as the market changes as the day progresses. Barring any new discoveries while learning market structure this weekend, my bias for next week is up.
Comments on my analysis and thought process please...
Just a quick pic of what Initiative buying looks like. If we get buying as price brakes the top of the Developing Value Area then it would be Responsive buying.
Ignored
re-reading some of the posts here, and this one stuck out.
HG, initiative buying is when price breaks the top of the value area and holds. If we get buying at unfair lows, this is responsive buying.
Im deeply impressed with this thread. studying this thread two days . Got some question
What trading platform do you use ???? any advices ???
Do we have any mt4 indicators ?
found here some indis but they dont work ,...
Will add here some pdf about AMT ,... etc
Ignored
i use MT4, but ninjatrader and tradestation are apparently great platforms for marketprofiles. For MT4, is use the MarketStatistics v5 indi and the iPolo market profile indi. Both can be found on the CSA with Malcomb thread.
i use MT4, but ninjatrader and tradestation are apparently great platforms for marketprofiles. For MT4, is use the MarketStatistics v5 indi and the iPolo market profile indi. Both can be found on the CSA with Malcomb thread.
Ignored
As I understand it, tradestation is not very user friendly.
It all depends on what you want to do. If you want to be able to merge and split profiles and look at traditional MP charts then you need
Also note that in the original inception, TPO counts were used as a proxy for VOLUME because volume was not available. Therefore a volume profile/histogram/ works as well. Simply, most of the time they volume profile and the TPO profile will give you the same levels.
Without VSA, you're playing checkers while the Smart Money plays chess.
re-reading some of the posts here, and this one stuck out.
HG, initiative buying is when price breaks the top of the value area and holds. If we get buying at unfair lows, this is responsive buying.
Ignored
I have been doing some study this weekend myself and you are correct.
Responsive buying happens at the low end of the value area and below and Initiative buying happens at the upper end and above. Of course the converse is true for Initiative selling and Responsive selling.
Without VSA, you're playing checkers while the Smart Money plays chess.