I thought I would post a trade I took earlier this morning, I have not posted any trades in a while, this trade was based off the daily chart with entry on the 4hr trigger chart. It missed the target I was looking for but I took it anyway. So far 145 pips to the good.
--NM
Ignored
Hi NM
nice to see you again.
what was the stratergy behind this trade, it doesn't look like a 3sma trade?
what was the stratergy behind this trade, it doesn't look like a 3sma trade?
Andy
Ignored
It is not the 3sma method, even though, he uses the completion of the 1,2,3 pattern as a trigger for entry.
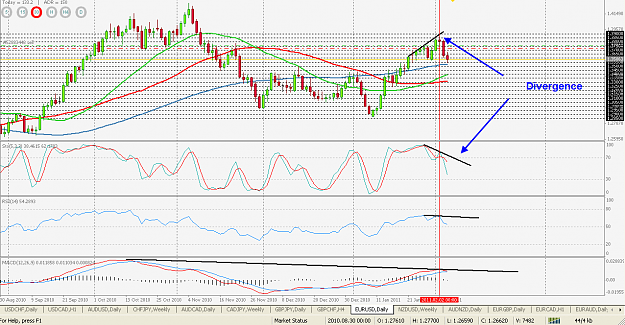
I think i understand what he did. First, he looked at the daily chart for double tops. Then, he superimpose the RSI indicator on the daily chart looking for solid divergence. After a good divergence rears it head, he then switch to the 4hour timeframe looking for a telltale signs of reversal, that is, the vaunted 1,2,3 formation on 4hr time frame. Then, at the completion of that 1,2,3 formation, he entered. I have attached a chart below.
MAYOROWO does the same thing. s/he sometimes go with a strong candle move like hammer/inverted hammer or something like a engulfing bar instead of waiting for the completion of the 1,2,3 formation.
Is it effective? On the daily time frames?....try it out and see. i dont like indicators though.
Anyways, chart attached
Joined Dec 2007
|
Status: Trading the Trends
|2,584 Posts
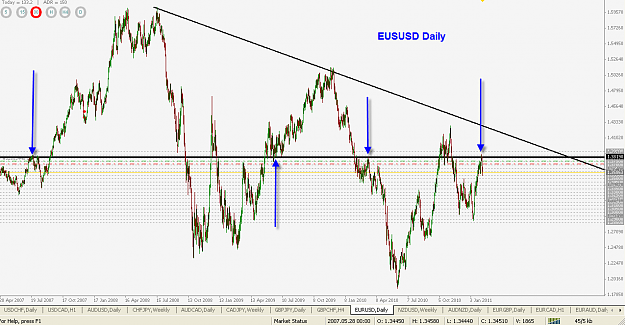
That is close to what I did, however I did not use any indicators. I did looked at the daily and then used the 4 hour as my trigger chart. Looking for the reversal pattern on the 4H time frame.
I do not always draw the trend lines when I take a trade, after a while you just get used to seeing the reversals and kind of know where they are going to develop (or expect them to develop) and when I see them then I use the 123 or BPC for an entry.
So the entry rules are still the same. Look for the trend, find the S/R levels and wait and see what happens at those levels and then make a decision to enter or scrap it.
Yep Custos is correct, it goes by currencies, then just look at the strong vs the weak currencies and pull up the charts and see if there is anything that looks good.
It is not the 3sma method, even though, he uses the completion of the 1,2,3 pattern as a trigger for entry.
I think i understand what he did. First, he looked at the daily chart for double tops. Then, he superimpose the RSI indicator on the daily chart looking for solid divergence. After a good divergence rears it head, he then switch to the 4hour timeframe looking for a telltale signs of reversal, that is, the vaunted 1,2,3 formation on 4hr time frame. Then, at the completion of that 1,2,3 formation, he entered. I have attached a chart below....
Ignored
Even though I do not use indicators I decided too pull up the MACD, RSI,and the Stochastic on the daily chart, all 3 of the indicators are also showing that a turn around could be drawing close by the divergence, as the price was making higher highs but the indicators were not able to make the trip.
Joined Dec 2007
|
Status: Trading the Trends
|2,584 Posts
Here is a chart of the daily I have marked the S/R levels I was hoping the change would happen at it missed somewhat but it was close enough for me to take the entry.
Even though I do not use indicators I decided too pull up the MACD, RSI,and the Stochastic on the daily chart, all 3 of the indicators are also showing that a turn around could be drawing close by the divergence, as the price was making higher highs but the indicators were not able to make the trip.
--NM
Ignored
I see that too. It was most pronounced on the STOCh. ANYWAYS, indicator is what mayorowo uses...personally, i dislike them.
Here is a chart of the daily I have marked the S/R levels I was hoping the change would happen at it missed somewhat but it was close enough for me to take the entry.
I see that too. It was most pronounced on the STOCh. ANYWAYS, indicator is what mayorowo uses...personally, i dislike them.
i see.
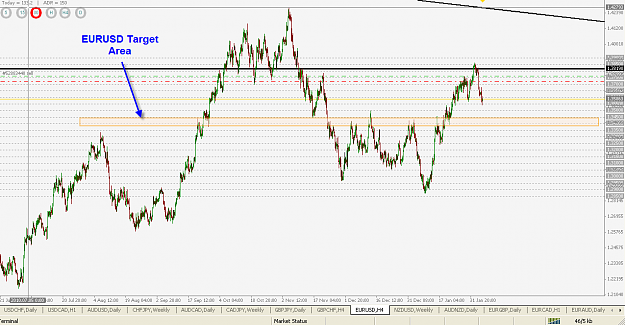
it eur/usd may yet reach that target line.
Ignored
It might reach the target, you never know in this market what will happen. Indicators are ok if you like them, personally I dont use them but many people do and seem to do ok with them. I have found they give a lot of mixed signals and I guess thats one of the reasons I dont use them, I would rather wait for the market to do something then react to it if you know what I mean.
I see that too. It was most pronounced on the STOCh. ANYWAYS, indicator is what mayorowo uses...personally, i dislike them.
i see.
it eur/usd may yet reach that target line.
Ignored
Guys, basically i trade support and resistance with a solid confluence, the RSI is not for entry but i use it get a clear divergence which has been helping me to detect a solid support and resistance. Over the time 40 percent of support and resistance don’t move more than 110 pips before they reverse while others move more than 250pips. Trading with confidence is what we need, to me confluence is all i need to pull any trigger e.g S/R with any of these fib,round numbers,divergence etc. Thanks
EURGBP's trend was down last week. I think EURGBP is still in down trend in this week. ADX, RSI, WPR, and STOCH show the powering of this trend.
Ignored
yeah, and my neighbour's cat was today walking across the street, which means eur/gbp is definitely down. Also I stood up today with my left foot, another good indication that eur/gbp is down.
I know, very dry humor (if you can call it humor at all)
|
Joined Jan 2011
|
Status: Student, teacher, trader
|89 Posts
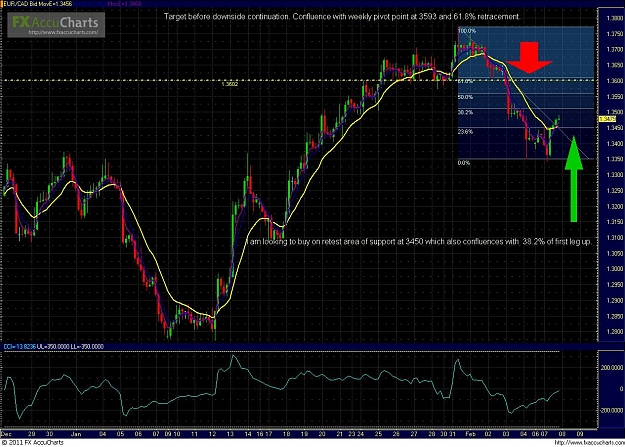
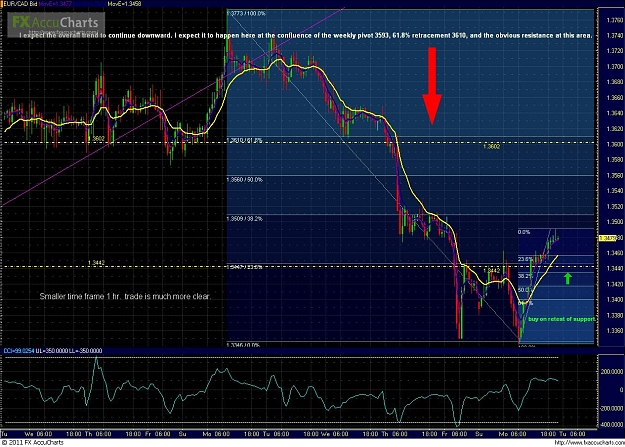
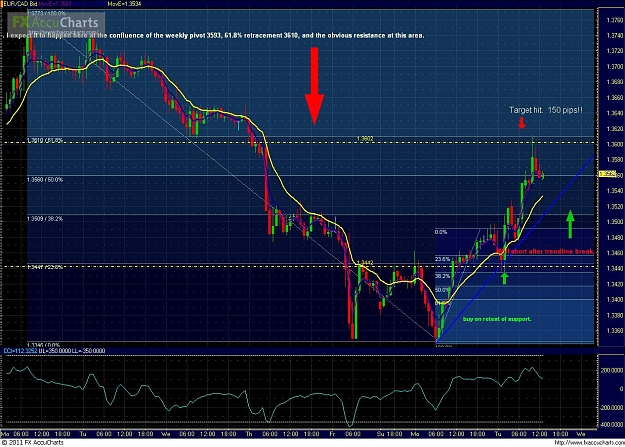
I expect a nice move to the upside for this week with the Eur/Cad pair. Tell me what you think. Overall, I expect the market to continue down for another leg, but cant resist the pips. Let me know what you guys think.
I made a mistake. The weekly pivot is at 3601, not 3593 which is even better.
|
Joined Jan 2011
|
Status: Student, teacher, trader
|89 Posts
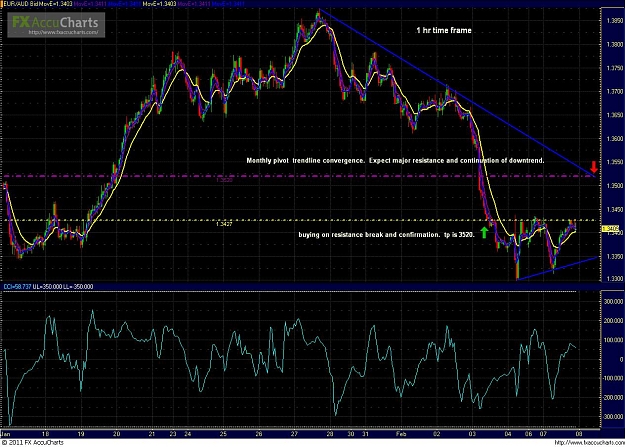
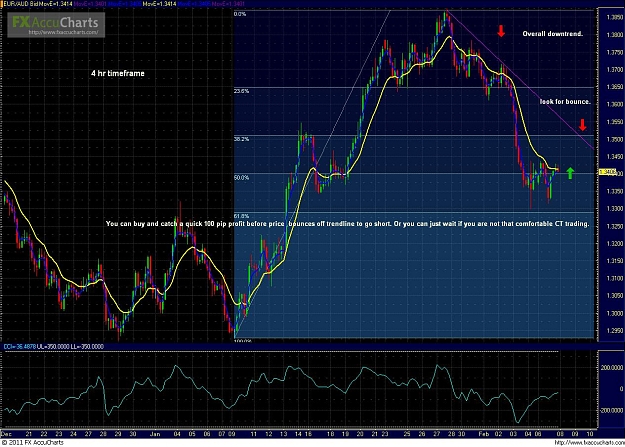
Similar to my Eur/Cad analysis, i expect the Eur/Aud to follow suit.
just not as many pips. Does any one agree or disagree?
Buy Eur/Aud above resistance with confirmation, and target Monthly central pivot point as well as convergence with downward trend line on 4 hr time frame.
|
Joined Jan 2011
|
Status: Student, teacher, trader
|89 Posts
Target hit for 150 pips. I am expecting a resumption of downtrend. I am waiting for a few signals to converge before shorting. But mainly, I need to see trend line to break.
yeah, and my neighbour's cat was today walking across the street, which means eur/gbp is definitely down. Also I stood up today with my left foot, another good indication that eur/gbp is down.
I know, very dry humor (if you can call it humor at all)
|
Joined Jan 2011
|
Status: Student, teacher, trader
|89 Posts
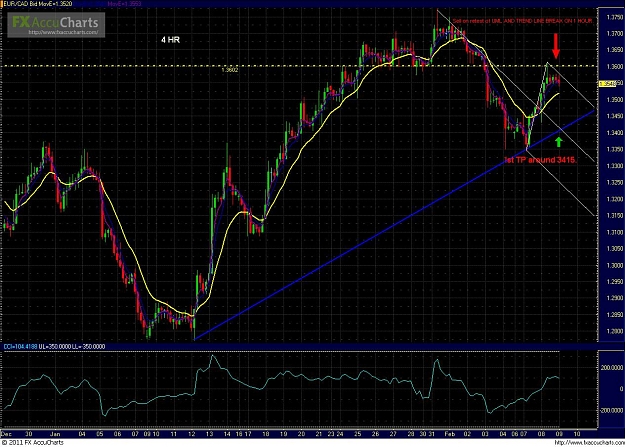
As a follow up to yesterday's +150 pip trade, I think it is a good time to sell eur/cad.
Sell:3565
TP: 3420 (confluence with monthly pivot point, and intersection between uptrend line and ML of pitchfork.
SL:3630.(I have to use wider stop to cover spread.)
1:2 risk/reward.