I actually meant the 1.02000 area and as you say, it must have been the bears jumping on the weak buyers there.
Ignored
Oh I wasn't aware you meant that first large push up. This is actually classic PA stuff. You get a stall out at the BRN(this case parity first time there in a long time , so as expected). THen price moves down slightly but the bears aren't there. Then you get a move above that last swing high and the true selling comes in shaking out all the weak sellers.
Oh I wasn't aware you meant that first large push up. This is actually classic PA stuff. You get a stall out at the BRN(this case parity first time there in a long time , so as expected). THen price moves down slightly but the bears aren't there. Then you get a move above that last swing high and the true selling comes in shaking out all the weak sellers.
After reading for few days this interesting thread I made my first demo trade.
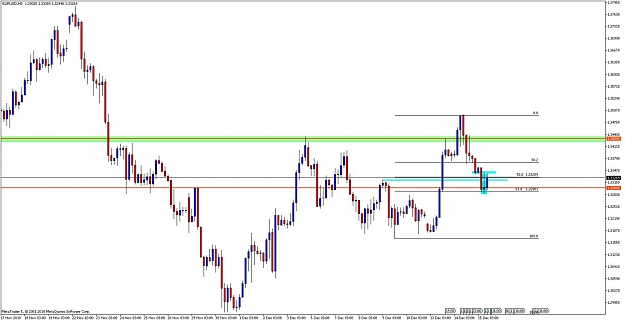
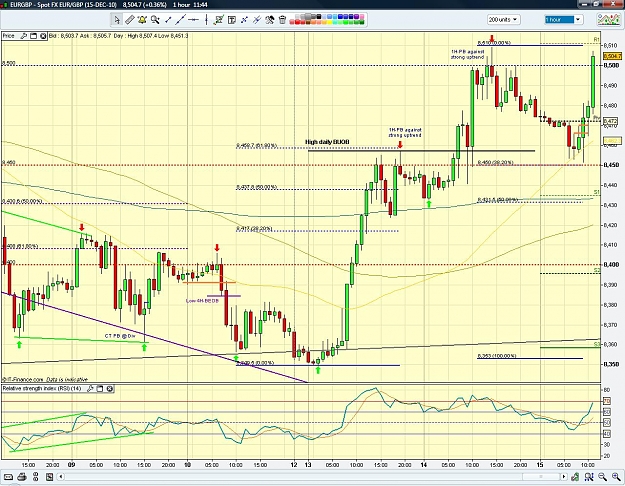
I took the trade - Pin Bar high was at resistance + Fibo 61.8. My Enter was at at Fibo 38.2 and wanted to Exit at Fibo 23.6. but after looking at risk (about 1400 pips) to reward (about 900 pips) I closed the trade.
ps. I'm going to take full bucket from your well of knowledge.
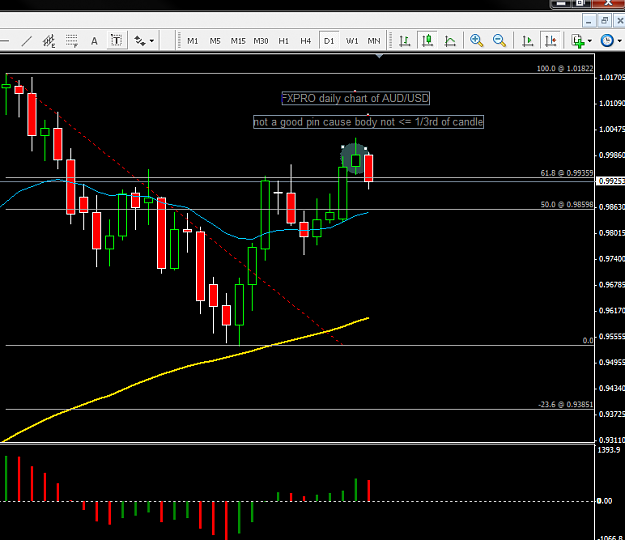
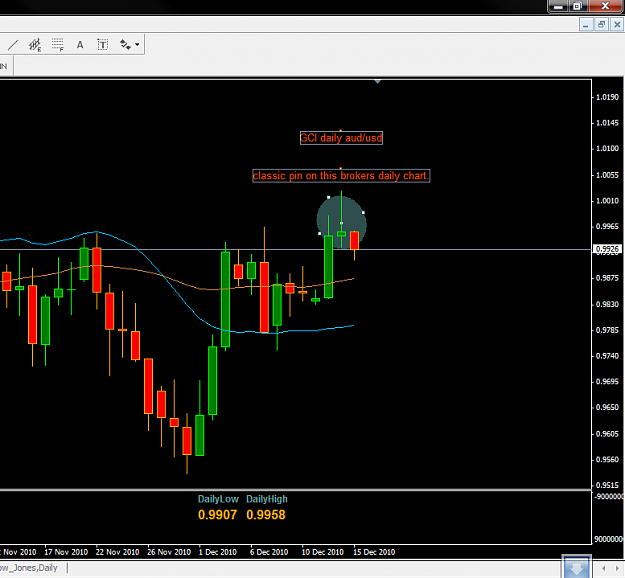
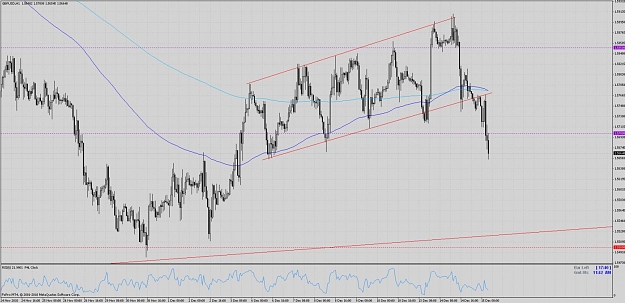
maybe some1 can answer this question, every MT4 broker's that have different timezones will show the close of daily weekly candles differently,(eg. one broker might look like a pin bar and the other not) is there a suggested broker that most of u use as to not have this confusion.
thx on advanced
I have attached the 2 brokers platforms that i use. you can clearly see the difference between the daily charts here.
Ignored
Hey T2, this same question was asked many times. Me too, had worries about this. The suggestion was to trade what you see, as we trade price not charts. If you see a perfect setup on any broker just take it.
Personally me I prefer FxPro for my dailies and do not compare setup to any other broker's charts.
what was the consensus of opinion on the EU daily pin? Anyone take it? would have liked to have seen it push a bit higher so gave it a miss. Any thoughts/opinions?
There you go Hans. The I4+B (I23B) on the Weekly Eur/Chf.
This one shows the beauty of this setup, meaning how the I4B is aligned with a BRN, 130.00.
The stop loss placement, like with all IBs, is at the opposite end of the I4B. But you can gauge the setup by how Price reacts to the BRN. In this case, the 130.00 acted as Resistance. You can see on the Daily, no bar closed above the 130.00.
Ideally we would like to see them break hard and never look back, but this one came close and made sense why it did, what it did.
Ignored
Hey Jarroo, thank you. I was a little bit disappointed yesterday that it did not work out like I expected (hard break). But it did what it was supposed to do. Next time I may trade a bar like this.
Im trying my best to take the best of the best... sometimes you see a big BEOB and you just wanna trade it..its like something impulsive..you see two confluence and.. Im in.. but im slowlyyyy becoming more picky, long way to go yet.
Ive gotta work bit more with the story of the setup, im missing some trades cause i see a very near FTA, but the story of the setup will make it valid, UJ 4hr BEOB we had on Monday was an example.
Thx for your words, buddy.
Ignored
Keep at it Os . . .you'll get there, friend .
Indicators show the past. Price Action "Indicates" the future.
|
Joined Jul 2010
|
Status: keeping it simple is complex enough
|989 Posts
Long trade E-G is working out quite nicely, price pulled back @ the high of the daily BUOB. It took me 2 attempts on the 10m-TF, first attempt price stopped me out on a nice 10m-BUOB for a full bar loss of 7 pips, second attempt also at one of the previous 1H-bar highs got me in again with more succes ........
Hi
Could anyone tell me how to set take profit areas when as in the gbpchf it is at the lowest since 1987 on my brokers platform.
Just thinking round numbers maybe
TIA
Grahame