• Home
  • Forums
  • Trades
  • News
  • Calendar
  • Market
  • Brokers
  • Login
  • Join
  • User/Email: Password:
  • 6:59pm
Menu
  • Forums
  • Trades
  • News
  • Calendar
  • Market
  • Brokers
  • Login
  • Join
  • 6:59pm
Sister Sites
  • Metals Mine
  • Energy EXCH
  • Crypto Craft

Options

Bookmark Thread

First Page First Unread Last Page Last Post

Print Thread

Similar Threads

Trading correlation pairs by using the other pairs 736 replies

Export All pairs or selected pairs to .csv with script 3 replies

Trailing SL EA with hard SLTP for all open trades & all pairs 3 replies

Daily Bar Analysis - All Pairs/All Welcome 15 replies

Trend Trading All Currency Pairs 3 replies

  • Interactive Trading
  • /
  • Reply to Thread
  • Subscribe
  • 4,037
Attachments: Trend Trading All Pairs
Exit Attachments

Trend Trading All Pairs

  • Last Post
  •  
  • 1 450451Page 452453454 656
  • 1 Page 452 656
  •  
  • Post #9,021
  • Quote
  • Nov 8, 2010 7:07pm Nov 8, 2010 7:07pm
  •  shiko
  • | Joined Feb 2009 | Status: Member | 2,444 Posts
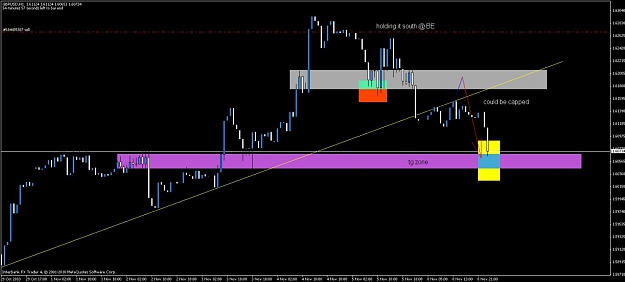
I am short Eur/Chf. set up on weekly, sntry on daily/ 4H. Nighmoves entry. break of retracement line.
 
 
  • Post #9,022
  • Quote
  • Nov 8, 2010 7:08pm Nov 8, 2010 7:08pm
  •  shiko
  • | Joined Feb 2009 | Status: Member | 2,444 Posts
Quoting Custos
Disliked
yeah, he seems to be an awesome trader.
Ignored

He is. I like his method but want to do something less stressful
 
 
  • Post #9,023
  • Quote
  • Nov 8, 2010 7:10pm Nov 8, 2010 7:10pm
  •  redsword11
  • Joined Nov 2008 | Status: living deliberately | 11,122 Posts
Quoting redsword11
Disliked
Attachment 575807
Ignored

Attached Image (click to enlarge)
Click to Enlarge

Name: cable.jpg
Size: 74 KB


closed it
 
 
  • Post #9,024
  • Quote
  • Nov 8, 2010 8:15pm Nov 8, 2010 8:15pm
  •  rubberband
  • | Joined Jun 2009 | Status: Member | 34 Posts
Setup: Blue line is a 100 bar SMA (close), Green bar is a 200 bar SMA (close) on an M5 chart, any currency. When these two SMAs are flat and Price converges with them, anticipate a trend. Being ready before the trend occurs will help you catch it as close to the start as possible.

I don't claim to know which direction price will trend (IMO it is 50/50), but for clues as to the direction I use the relationship of price to the H1 100 SMA and H1 200 SMA (price above both, bullish, price below both, bearish, price inbetween both, neutral), and the previous trend's direction. A 20 pip SL should be plenty, shoot for a 1:3 or greater risk to return ratio. I do not claim to be the originator of this setup but am convinced it works. Convince yourself ... put those two SMAs on any currency's M5 chart and see what happened after the SMAs got flat and converged with price ... a trend follows.

http://www.johnferguson.net/images/Lessonplan2.jpg
 
 
  • Post #9,025
  • Quote
  • Nov 8, 2010 8:27pm Nov 8, 2010 8:27pm
  •  shiko
  • | Joined Feb 2009 | Status: Member | 2,444 Posts
nice, now it looks like pin bar forming on Gbp/Usd. on IB FX.
 
 
  • Post #9,026
  • Quote
  • Nov 8, 2010 8:34pm Nov 8, 2010 8:34pm
  •  Iamfx
  • | Joined Apr 2009 | Status: Member | 518 Posts
Quoting shiko
Disliked
nice, now it looks like pin bar forming on Gbp/Usd. on IB FX.
Ignored
Shiko
Still 2.5 hrs to go for this to finish forming on zero gmt but if it does will you trade the upside break of it or will you wait for the BPC?
We are all One. Be present. Be the Observer
 
 
  • Post #9,027
  • Quote
  • Nov 8, 2010 9:37pm Nov 8, 2010 9:37pm
  •  Andy_G
  • | Joined Jan 2010 | Status: Member | 49 Posts
Quoting Iamfx
Disliked
I cant answer the exit question but it looks like its setting up for a nice BPC reentry
Ignored
as it didn't make a new lower low, it could be changing direction?
 
 
  • Post #9,028
  • Quote
  • Nov 8, 2010 9:39pm Nov 8, 2010 9:39pm
  •  Bandit
  • | Membership Revoked | Joined Jun 2009 | 48 Posts
short EUR/JPY at 112.35 on the hourly bpc.
 
 
  • Post #9,029
  • Quote
  • Nov 8, 2010 9:42pm Nov 8, 2010 9:42pm
  •  Bandit
  • | Membership Revoked | Joined Jun 2009 | 48 Posts
Quoting Andy_G
Disliked
as it didn't make a new lower low, it could be changing direction?
Ignored
It seems to be reversing after reaching the daily close. close are also important, not just the lows.
 
 
  • Post #9,030
  • Quote
  • Nov 8, 2010 10:16pm Nov 8, 2010 10:16pm
  •  Iamfx
  • | Joined Apr 2009 | Status: Member | 518 Posts
Quoting Bandit
Disliked
short EUR/JPY at 112.35 on the hourly bpc.
Ignored
I see what you mean by the BPC but h4 trend is murky according to ma's so not sure if this is A+ setup. Weekly is down and daily has broken TL so should be OK but what the hell do I know.
We are all One. Be present. Be the Observer
 
 
  • Post #9,031
  • Quote
  • Nov 8, 2010 11:03pm Nov 8, 2010 11:03pm
  •  rubberband
  • | Joined Jun 2009 | Status: Member | 34 Posts
And again, and again. Works on every pair.

http://www.johnferguson.net/images/workedagain.jpg
 
 
  • Post #9,032
  • Quote
  • Nov 8, 2010 11:17pm Nov 8, 2010 11:17pm
  •  rubberband
  • | Joined Jun 2009 | Status: Member | 34 Posts
http://www.johnferguson.net/images/evengold.jpg
 
 
  • Post #9,033
  • Quote
  • Nov 8, 2010 11:40pm Nov 8, 2010 11:40pm
  •  rubberband
  • | Joined Jun 2009 | Status: Member | 34 Posts
Another trend prediction ... twice on the guppy tonight. Over and over and over ... it works.

http://www.johnferguson.net/images/guppy.jpg
 
 
  • Post #9,034
  • Quote
  • Nov 9, 2010 12:40am Nov 9, 2010 12:40am
  •  Bandit
  • | Membership Revoked | Joined Jun 2009 | 48 Posts
Quoting Bandit
Disliked
short EUR/JPY at 112.35 on the hourly bpc.
Ignored
i am at +32 pips. which is equal to my risk. i am moving my SL to breakeven entry point +2 pips. 112.33

111.60 and 106.30 are my final price targets. any suggestions, custos?
 
 
  • Post #9,035
  • Quote
  • Nov 9, 2010 1:48am Nov 9, 2010 1:48am
  •  Custos
  • Joined Dec 2006 | Status: Member | 3,852 Posts
Quoting rubberband
Disliked
Setup: Blue line is a 100 bar SMA (close), Green bar is a 200 bar SMA (close) on an M5 chart, any currency....
Ignored
I was wondering one thing, how do you avoid fakeouts? What is your exact entry rule?
 
 
  • Post #9,036
  • Quote
  • Nov 9, 2010 1:50am Nov 9, 2010 1:50am
  •  Custos
  • Joined Dec 2006 | Status: Member | 3,852 Posts
Quoting Bandit
Disliked
i am at +32 pips. which is equal to my risk. i am moving my SL to breakeven entry point +2 pips. 112.33

111.60 and 106.30 are my final price targets. any suggestions, custos?
Ignored
well, good overall, but I would let it run further.
 
 
  • Post #9,037
  • Quote
  • Nov 9, 2010 2:06am Nov 9, 2010 2:06am
  •  Bandit
  • | Membership Revoked | Joined Jun 2009 | 48 Posts
Quoting Custos
Disliked
I was wondering one thing, how do you avoid fakeouts? What is your exact entry rule?
Ignored
Thank you. I see that as major problem for him. a consolidation can expand or shrink in size., resulting in fakeouts after fakeouts after fakeouts. that is why we draw those lines and look for breakouts from them. the other time he was showing us a demo trade -- that apparently is suppose to prove that spike trading works. what a dunce. the fact that you can trade spike in demo doesnt mean you can trade it live. demo accounts are not real accounts. there are market executions that goes through with demo that doesnt go through with real accounts.

i thoroughly like how he comes in and post ex-post facto charts and scream "this works all the time!" like an imbecile choking on popcorn.
 
 
  • Post #9,038
  • Quote
  • Nov 9, 2010 2:14am Nov 9, 2010 2:14am
  •  NaughtyPip
  • Joined Aug 2010 | Status: Member | 1,282 Posts
Quoting rubberband
Disliked
Setup: Blue line is a 100 bar SMA (close), Green bar is a 200 bar SMA (close) on an M5 chart, any currency. When these two SMAs are flat and Price converges with them, anticipate a trend. Being ready before the trend occurs will help you catch it as close to the start as possible.

I don't claim to know which direction price will trend (IMO it is 50/50), but for clues as to the direction I use the relationship of price to the H1 100 SMA and H1 200 SMA (price above both, bullish, price below both, bearish, price inbetween both, neutral), and the...
Ignored

Ive mentioned this before, these are inside bar setups, which we already actually use to further confirm certain setups (without the need for ma's i might add) Check your 1 hr chart, the inside bar was there.
 
 
  • Post #9,039
  • Quote
  • Nov 9, 2010 2:19am Nov 9, 2010 2:19am
  •  Bandit
  • | Membership Revoked | Joined Jun 2009 | 48 Posts
Quoting NaughtyPip
Disliked
Ive mentioned this before, these are inside bar setups, which we already actually use to further confirm certain setups (without the need for ma's i might add) Check your 1 hr chart, the inside bar was there.
Ignored
totally. look at D1/h4, 61% FIB, trendline perfect touch, 132.00 rn to the pip. it is a solid short danuk approach on 5th of november. the harami completed itself at 131.55. nothing special to it. in fact, you can also see the 1,2,3 formation on h1(completed at 131.31).
 
 
  • Post #9,040
  • Quote
  • Edited at 2:35am Nov 9, 2010 2:23am | Edited at 2:35am
  •  Custos
  • Joined Dec 2006 | Status: Member | 3,852 Posts
This is a post about how to find your edge in this business.

What is our biggest problem as discretionary traders? It is really hard and takes long time to backtest our systems, since we have to do that manually by opening an excel sheet and typing in opening price, opening date, closing price, closing date and so on (except if you are an excellent programmer). And since you can already see the PA after your "supposed" entry, you unconsciously will bias your entry choices.
Secondly, you would also need to be a really good statistician to find out your profit factor, sharpe ratio and blablabla. So how do we find out, if we have an edge and how big it is?
Well, I think I found an answer to that. There are two little neat programs that should accomplish the job. (I hope you guys don't consider that as promotion or something, I have no affiliation. If you have a problem with that post, please tell me or the moderator and I will delete it)

The first one is the forex tester, which I already talked about for speeding up the market and punching in orders in a matter of hours, instead of months and totally unbiased , since we are not shown future price action. However, what that program lacks is to find out how big our edge is, no statistics capability.
Well, here comes the software market system analyzer in place. You just export your account history from forex tester into excel and import all your trades into the market system analyzer. Now here you can do some really good statistical analyses, and if you really find that your system has a good edge, it allows you to optimize your money management rules.

Just a suggestion, cause I know how hard it normally is to do that all by yourself. And there is a big difference between thinking one has an edge and between knowing one has an edge and how big it is.

cheers
 
 
  • Interactive Trading
  • /
  • Trend Trading All Pairs
  • Reply to Thread
    • 1 450451Page 452453454 656
    • 1 Page 452 656
0 traders viewing now
  • More
Top of Page
Forex Factory Blog Updated: Alerting All Members
  • Facebook
  • Twitter
About FF
  • Mission
  • Products
  • User Guide
  • Media Kit
  • Blog
  • Contact
FF Products
  • Forums
  • Trades
  • Calendar
  • News
  • Market
  • Brokers
  • Trade Explorer
FF Website
  • Homepage
  • Search
  • Members
  • Report a Bug
Follow FF
  • Facebook
  • Twitter

FF Sister Sites:

  • Metals Mine
  • Energy EXCH
  • Crypto Craft

Forex Factory® is a brand of Fair Economy, Inc.

Terms of Service / ©2022