I think today all pairs daily ATR is almost used up. So, it is probably a good idea to wait for another day. I see good short set up forming USD/CHF on daily with trigger on 4H chart. Hit Fib 50 where nice resistance was, now coming back to test contra trend retracement as per NightMoves method. Wilol be waiting for bpc on 4H.
I believe you talk about e/j.
I think you are moving stop to b/e too soon and not considering the S/R levels.
Most of the time market will move through a level and then TEST it from BELOW. You moved your stop directly in front of the S/R level which was very likely to get tested from below. I would rather put your stop above the S/R level, cause otherwise you don't give the trade any chance to come to fruition.
cheers
Ignored
Yes, exactly. Again stopped. I actually did not expect it to run as bigger retracement line was not broken and especially that 113.00-112.80 level still holds. BTW, Bernarke is talking today, so everything still is possible.
I think today all pairs daily ATR is almost used up. So, it is probably a good idea to wait for another day. I see good short set up forming USD/CHF on daily with trigger on 4H chart. Hit Fib 50 where nice resistance was, now coming back to test contra trend retracement as per NightMoves method. Wilol be waiting for bpc on 4H.
Ignored
hm, can you please show a chart. I think usd/chf still has a bit to go to some real resistance. Also not sure how you have drawn your fibs, I can't get mine to line up with a 50 fib.
best regards.
attached is usd/chf weekly with S/R levels marked.
I believe you talk about e/j.
I think you are moving stop to b/e too soon and not considering the S/R levels.
Most of the time market will move through a level and then TEST it from BELOW. You moved your stop directly in front of the S/R level which was very likely to get tested from below. I would rather put your stop above the S/R level, cause otherwise you don't give the trade any chance to come to fruition.
cheers
Ignored
I agree. It was exactly where I entered and previous support. I should probably set stop few pips above my entry to risk few pips after I closed half trade.
hm, can you please show a chart. I think usd/chf still has a bit to go to some real resistance. Also not sure how you have drawn your fibs, I can't get mine to line up with a 50 fib.
best regards.
attached is usd/chf weekly with S/R levels marked.
Yes, exactly. Again stopped. I actually did not expect it to run as bigger retracement line was not broken and especially that 113.00-112.80 level still holds. BTW, Bernarke is talking today, so everything still is possible.
Ignored
hm, again, can you show a chart which retracement line you talk about? On my chart it has already been broken. (eurjpy h4)
Well, and concerning that level still holding, it is my belief that this means price wants to break through actually. The longer a level gets used, the less order will sit there and the weaker the level will become until it eventually breaks. If it was a strong level, price would have bounced off at the first or second touch, but not just sitting there.
Against just my opinion
Best regards.
Ignored
Yes, that line was broken on my chart too, but for 1H trigger I am watching for confluence of 113.00-112.80 level along with contra trend retracement on 1H to have bpc to enter. Entered on bpc on inside 15 min chart contra trend line which is on this chart as well. But higher time frame contra trend retracement and support still held well.
Yes, that line was broken on my chart too, but for 1H trigger I am watching for confluence of 113.00-112.80 level along with contra trend retracement on 1H to have bpc to enter. Entered on bpc on inside 15 min chart contra trend line which is on this chart as well. But higher time frame contra trend retracement and support still held well.
oh, that's how you have drawn that line. I know there are no hard rules, but I always only draw the retracement trendline from the low to the highest high of the retracement move
high 1 is higher than high 2, thus I would not adjust the retracement trendline. I think that's how it's done typically.
If however the formation looks like a triangle or range, you can disregard that rule.
So one could argue that it looks a bit like a triangle. Again no hard rules here. But for me personally the retracement trendline is broken.
well, since you are listening , I tell you what I think.
I would draw the fibs from either one of the highs where my blue arrows point to (cause they are so close to each other, it probably doesn't matter which one you use). And secondly, a little more insignificant, but in my opinion also viable: the high where my orrange arrow points to. I can't really explain why I would use that one, but it is just more significant to me, than the high you used.
And lastly, I noticed you were drawing the S/R level on your trigger chart instead of the setup chart. Please never do that, the levels on the trigger chart are so insignificant. You always should draw your S/R levels from the setup chart or higher.
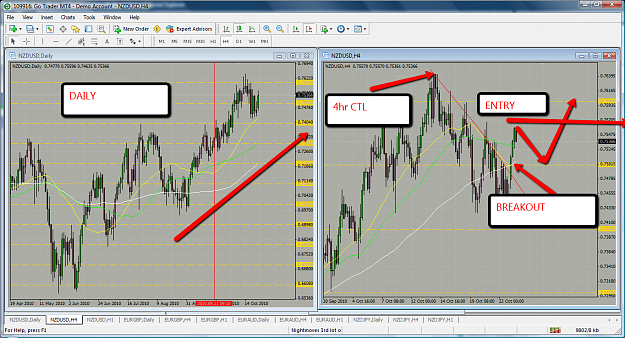
Could someone please comment on the validty of this possible setup
Cheers
Ignored
yeah in general it's okay. But on the weekly time-frame you will see that we just reached a high. So that might hinder that trade. Other than that I think it's okay.