Making the calculation for the Asian session we obtain the following High/Low Break Outs.
Ignored
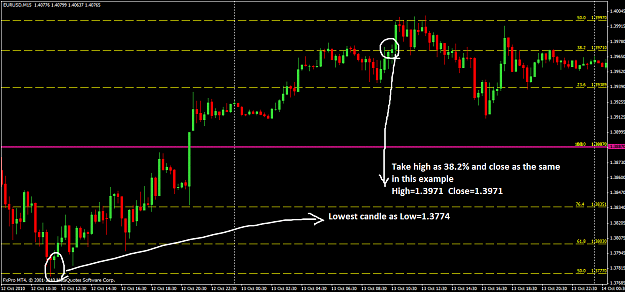
Take close of the highest price to find the breakouts and the levels which may confirm break outs.
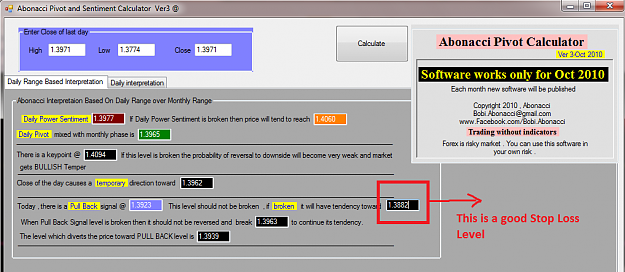
Now I calculate as follow:
High=1.4093 L=3954 Close=1.4078
Dear Aebab, thanks for the prompt reply, however 60 pips would have still hit my stoploss as it went 63 pips from 38.2 (in my chart).
Is it possible to show us how do you calculate it through the version 3 calculator. what will be the high,low, close and which level would determine the SL.
will you calculate the high,low close of the last candle after crossing 38.2? iam using power template 3. Please let us know which level on the calculator shows the stop loss. is it the pull back signal?
Hi,
I saw your posts and I think you are getting system very well . But please refer to the rules:
[color=red]7-If price goes 302 pips away from Base Line in Abonacci Phase Template , then trend will be in that way . For example if price goes high away from Base Line , then you can say that month is still UPTREND and vice versa .In that case price will reach to 3th phase and if passes 23.6% of 4th phase , it will reach to 100% level of 4th phase.But if price goes away 429 pips from the Base line , then...
Ignored
We have completed phase 3 this morning and have also broken 23.6% of Phase 4. According to the RULES, price will reach 100% of Phase 4 at 1.4181. Please correct me if I'm wrong.
We have completed phase 3 this morning and have also broken 23.6% of Phase 4. According to the RULES, price will reach 100% of Phase 4 at 1.4181. Please correct me if I'm wrong.
Ignored
Yes . You are right . But be aware of swinging like we had some days ago and now it came to finish its journey .
Yes . You are right . But be aware of swinging like we had some days ago and now it came to finish its journey .
Ignored
Thanks for the warning Bobi, but all I need to know is where price is going. Thanks to you, I know where price is head. Rest of it should be upto the individual trader to do with their money management. I do not take large positions. I take smaller lots, wait for it to make a bit of profit, take half the position off the table, wait for pullback, enter small lots again, etc.
I had a brief discussion with aebab today to better understand how to correctly read the calculator interpretations, below is the excerpt from the discussion...
[3:56:55 PM] house43: Bobi pls if you have some few minutes, i need you to explain something to me [3:57:23 PM] Bobi Abonacci: ok. [3:58:53 PM] house43: pls i need you to take me through the calculator daily range based interpretation and the daily interpretation [3:59:12 PM] Bobi Abonacci: which day?
[font="][3:59:17...
Take close of the highest price to find the breakouts and the levels which may confirm break outs.
Now I calculate as follow:
High=1.4093 L=3954 Close=1.4078
Ignored
sorry for my ignorance but I'm new,
FxPro Plateform is in GMT+2, I would like to know at wath time GMT are Asian Market please ?
It'is exactly 14h11 GMT+1
On my plateform FXpro, yesterday NY was :
H 1.4001
L 1.3911
C 1.3961
Is that correct ?
And to calculate After Asian session, what's time (O,H,L,C) asian session please ?
Ignored
Trader 91,
Those are the correct times. I used the same platform as LL.
You might want to check your Low though, technicaly it was 1.39116 which would make it on a four decimal 1.3912. Not trying to be picky, just letting you know what I had.
Also, FXPRO's prices differ between live and demo..... just so you know.
I have attempted to simplify the understanding of the Daily Interpretation by
visually adding some descriptions on the image. I hope this helps some of you
to better understand this awesome tool created by Bobi !!
Thanks 4fingers. Any chance you could do the same for daily range based interpretation although Bobi explained it quite well, it would be easier to have it on the chart.
Those are the correct times. I used the same platform as LL.
You might want to check your Low though, technicaly it was 1.39116 which would make it on a four decimal 1.3912. Not trying to be picky, just letting you know what I had.
Also, FXPRO's prices differ between live and demo..... just so you know.