• Home
  • Forums
  • Trades
  • News
  • Calendar
  • Market
  • Brokers
  • Login
  • Join
  • User/Email: Password:
  • 7:30am
Menu
  • Forums
  • Trades
  • News
  • Calendar
  • Market
  • Brokers
  • Login
  • Join
  • 7:30am
Sister Sites
  • Metals Mine
  • Energy EXCH
  • Crypto Craft

Options

Bookmark Thread

First Page First Unread Last Page Last Post

Print Thread

Similar Threads

Strat's PASR Long Term, Stress Free Trading 16,459 replies

M5 PASR Trend Trading Strat 95 replies

What you need for trading: indis, a strat & good music 27 replies

Another way to stress free, mechanic long term trading 29 replies

Short Term / Medium Term / Long Term? 3 replies

  • Commercial Content
  • /
  • Reply to Thread
  • Subscribe
  • 8,452
Attachments: Strat's Long Term Stress Free Trading
Exit Attachments
Tags: Strat's Long Term Stress Free Trading
Cancel

Strat's Long Term Stress Free Trading

  • Last Post
  •  
  • 1 721722Page 723724725 1087
  • 1 Page 723 1087
  •  
  • Post #14,441
  • Quote
  • Oct 7, 2010 10:56pm Oct 7, 2010 10:56pm
  •  asiatrader
  • | Joined Jun 2004 | Status: Member | 5 Posts
Quoting asiatrader
Disliked

I used to be a 'aim-less' trader, looking at various trading systems at the same time, and overload with fundemental information that my little brain cannot cope. Though Price Action is not new to me, it is only with Strat's thread and his strong conviction that I finally manage to stick to only 1 system - PASR.
Ignored
Another important point that I would like to share that helps me to turn my trading success ratio around (over the last few months) is a total mental shift in looking at charts.

Last time, I used to look at charts and search for all possible entry points to put in trade. I will look at all the different candle patterns that indicate a possible 'reversal' trade. The little brain will tell me to go for these trades as the returns are higher, as trend cannot go on forever. Though I have SR and Fibo levels on the chart, these doesn't help much as most of time, I'm trading against the trend.

After some serious fight with the grey cells between my ears, I did a 180 degrees turn in looking at charts. These are what I learnt :-

1) Look at multiple time frame (W, B and BB) to determine the trend.
2) Do not trade when the pair is not trending.
3) Trade along the trend... counter-trend trades are much more difficult to execute.
4) Look at candle patterns around SR lines to determine the entry point.
5) Look at candle patterns relative to where it appears on the chart.

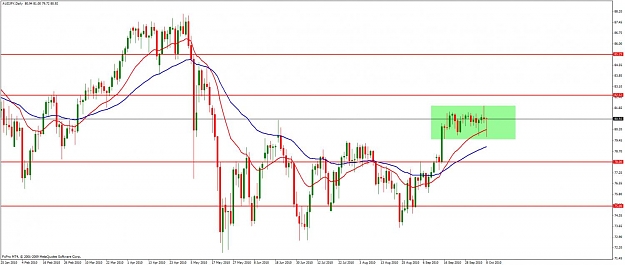
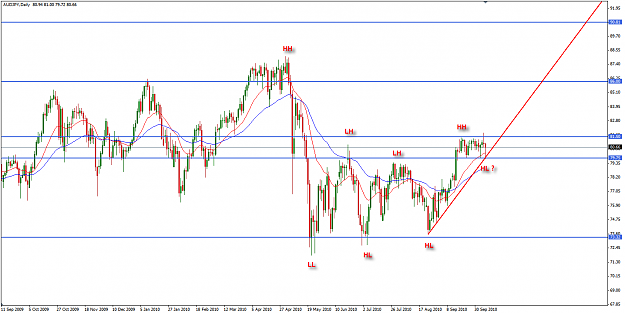
A very good example will be the USDJPY pair in the last few months, in my old self, I will go Long this pair in all possible reversal situations, thinking that it cannot go any lower. With the help of this thread, I'm can see the bigger picture much clearer and don't stand in front of the rock that is rolling down the slope.

Hope my personal experience will help more people in this thread.

Still learning,
AT
 
 
  • Post #14,442
  • Quote
  • Oct 8, 2010 4:37am Oct 8, 2010 4:37am
  •  dorellino
  • | Joined Nov 2006 | Status: Melius abundare quam deficere | 163 Posts
Quoting asiatrader
Disliked
Another important point that I would like to share that helps me to turn my trading success ratio around (over the last few months) is a total mental shift in looking at charts.

Last time, I used to look at charts and search for all possible entry points to put in trade. I will look at all the different candle patterns that indicate a possible 'reversal' trade. The little brain will tell me to go for these trades as the returns are higher, as trend cannot go on forever. Though I have SR and Fibo levels on the chart, these doesn't help much as...
Ignored
You have just written something that I was thinking for long time, but I was too lazy to write it down.
Yes, indeed what you wrote is one of the first big lessons we learn when we enter Strat's world. Thanks!
Godspeed
Max
 
 
  • Post #14,443
  • Quote
  • Oct 8, 2010 11:24am Oct 8, 2010 11:24am
  •  MoneyMaker
  • | Joined Jun 2009 | Status: Learning to fish.... | 92 Posts
Quoting asiatrader
Disliked
thinking that it cannot go any lower.

Still learning,
AT
Ignored

Here's something I've learned....

Never let the charts or the data or any of the trappings of trading distract you from one simple truth: You are trading and watching opinion and psychology unfold, and the representation of that is on the chart you are watching. The minute that you forget that people’s emotions move the markets, you will continually be blindsided by the improbable and the unseen. The markets can go to infinity and down to zero. Never believe anything is too high, too strong, too weak, or too low.
 
 
  • Post #14,444
  • Quote
  • Oct 8, 2010 11:31am Oct 8, 2010 11:31am
  •  Strat
  • Joined Feb 2009 | Status: 14 YEAR PASR THREAD Senior Member | 11,766 Posts
Quoting samsonwebdes
Disliked
Hi Strat,
Couple of questions if I may regarding your comment on NFP.
Do you recommend staying out of trades on all pairs prior to NFP or just the USD crosses?
How many days before NFP would you stay out for?
Ignored
Usually, the impact of NFP news hits the short time frame traders hardest. Occassionally it impacts those of us who trade the Daily chart resulting in higher than normal volatility. Most times though, the impact and volatility is contained within the Daily ATR(10).

I believe all the news is already factored into the Market by the time the News hits the Street but there are times when we see reactions to the reactions.

If I already have positions, I make sure my SL protects my profits or if the news is expected to be adverse to my positions, I will tighten my SL.

I will enter new positions at the beginning of NFP week but never on a Thursday and never on an NFP Friday until all the dust has settled.

Many times the news is to my advantage but staying out is the dice I roll.

The biggest impact of NFP is all things $US related and this sometimes carries over to other pairs (depending on the news).

Capital Preservation is our # 1 Rule.
14 YEARS OF PASR ON FOREX FACTORY!
 
 
  • Post #14,445
  • Quote
  • Oct 8, 2010 11:35am Oct 8, 2010 11:35am
  •  Strat
  • Joined Feb 2009 | Status: 14 YEAR PASR THREAD Senior Member | 11,766 Posts
Quoting asiatrader
Disliked
Another important point that I would like to share that helps me to turn my trading success ratio around (over the last few months) is a total mental shift in looking at charts.

Last time, I used to look at charts and search for all possible entry points to put in trade. I will look at all the different candle patterns that indicate a possible 'reversal' trade. The little brain will tell me to go for these trades as the returns are higher, as trend cannot go on forever. Though I have SR and Fibo levels on the chart, these doesn't help much as...
Ignored
Congratulations - you have just taken valuable steps on The Path of Learning.

To appreciate USDJPY - read over and over and UNDERSTAND my Dr. Joe post.
14 YEARS OF PASR ON FOREX FACTORY!
 
 
  • Post #14,446
  • Quote
  • Oct 8, 2010 11:41am Oct 8, 2010 11:41am
  •  Strat
  • Joined Feb 2009 | Status: 14 YEAR PASR THREAD Senior Member | 11,766 Posts
Interesting! All the reports I read were calling for IMPROVED figures! I must be reading the wrong reports - better to stop reading altogether.


US sees 95,000 jobs lost in September

High unemployment is undermining the US recovery
The US economy lost another 95,000 jobs in September, as public sector cuts outpaced hiring by the private sector.
According to the Labor Department figures, the fall was almost double August's 54,000 job loss number.
The jobless rate held at 9.6%, but still marks the 14th straight month it has been above 9.5%.
A total of 159,000 government lay-offs were made in September, with the private sector adding 64,000 positions, the weakest gain since June.
The jobs news has raised expectations that the US Federal Reserve will take further action to pump money into the economy.
But any moves by the Fed to boost the economy are widely expected to include asset purchases rather than further interest rate cuts.
The jobless data is the Labor Department's final report before November's elections to Congress, when the Democrats will come under intense pressure about the state of the economy.
Of the public sector job cuts, about 76,000 were in local government, with a large number of lay-offs among teachers, analysts said.
The so-called "under-employment rate" - those who have given up looking for work or are part-timers seeking full-time posts - rose to 17.1% in September from 16.7% in August.
Sectors showing jobs growth included healthcare, retailing, and leisure and hospitality.
In the private sector, the manufacturing and construction industries cut the most jobs.
Meanwhile, revisions to data for July and August showed 15,000 more jobs were lost in those months than previously reported.

14 YEARS OF PASR ON FOREX FACTORY!
 
 
  • Post #14,447
  • Quote
  • Oct 8, 2010 11:47am Oct 8, 2010 11:47am
  •  Strat
  • Joined Feb 2009 | Status: 14 YEAR PASR THREAD Senior Member | 11,766 Posts
On its way to 1995 lows (as long as BOJ keep their fingers out!)

Japan stimulus to inject $60bn into flagging economy

The Japanese prime minister faces seemingly unsolvable economic problems


The Japanese cabinet has approved a plan to pump more than $60bn (Ł38bn) into the country's struggling economy.


The aim of the plan - which still needs approval from parliament - is to boost growth, jobs and spending.


The Japanese economy is suffering from deflation and a strong currency; prices keep falling, but consumers hold off spending in hope of lower prices.


Analysts said the key problem is that the yen is at a 15-year high, making exports more expensive.


Earlier this week, the Bank of Japan set interest rates at just above zero.
Japan's Nikkei newspaper said the plan could boost GDP growth by up to 0.6% and help to save jobs.

Yen dollar doldrums An extra budget is needed from parliament to fund the stimulus plan. This is expected to be submitted to parliament for debate later this month.


A previous stimulus package, announced last month, was intended to create about 200,000 jobs and shift GDP into positive territory, but was criticised as not going far enough.

JAPANESE YEN V US DOLLAR

Last Updated at 08 Oct 2010, 08:36 ET http://www.bbc.co.uk/news/business/m...bel_spacing=30 Ą1 buys change % 0.0122 + +0.00
+ +0.68


At the heart of Japan's woes is the strong yen, which has gained almost 50% in value against the dollar since mid-2007.


Japan has been stuck for the last 20 years in what economists call a "liquidity trap" - falling prices, interest rates stuck at zero, but savings rates remaining stubbornly high.


Much of the recent yen strength is actually to do with dollar weakness - the US has also cut rates virtually to zero and faces the risk of sinking into a liquidity trap just like Japan.


Despite the additional spending measures in the supplementary budget, Mr Kan has made clear that Japan must cut its budget deficit in the medium term.


Japanese government debt has risen to about twice the size of its economy during the last two decades of poor growth.

14 YEARS OF PASR ON FOREX FACTORY!
 
 
  • Post #14,448
  • Quote
  • Edited 2:08pm Oct 8, 2010 2:05pm | Edited 2:08pm
  •  Money Magnet
  • | Joined Jul 2007 | Status: Think Wealth | 184 Posts
Quoting Baniu
Disliked
Ok I see it.
So you would consider taking trade on this hammer as very risky because
Boss hasn't said his last word?

When it comes to opportunities on AUD crosses lately, which one would you
consider to be the best and why? Audcad, Audusd?

Thanks
Chris
Ignored
Chris for me, I have not looked too closely here but I see need to see PA above resistance (81.50 for me) before I'm intrested.

thanks
Frank
 
 
  • Post #14,449
  • Quote
  • Oct 8, 2010 2:59pm Oct 8, 2010 2:59pm
  •  geniusztc
  • Joined Jun 2010 | Status: Hello,Mr.Market | 1,805 Posts
hello,everyone .

i have learned the thread some time .of course,i do analysis ,and i trade though the charts with my analysis.but ,i just do not know whether is there anything wrong with my homework. in the attachments ,there are some charts with my analysis ,can you give me some of your time and watch my charts .i need your advice and criticism.

thank you very very very much. give my best wishes to all of you .
Attached File(s)
File Type: zip charts.zip   451 KB | 432 downloads
A chart helps those who can read it.
 
 
  • Post #14,450
  • Quote
  • Oct 8, 2010 3:04pm Oct 8, 2010 3:04pm
  •  CrudeCraig
  • | Joined May 2009 | Status: Member | 424 Posts
Quoting Baniu
Disliked
Ok I see it.
So you would consider taking trade on this hammer as very risky because
Boss hasn't said his last word?

When it comes to opportunities on AUD crosses lately, which one would you
consider to be the best and why? Audcad, Audusd?

Thanks
Chris
Ignored
So you would consider taking trade on this hammer as very risky because
Boss hasn't said his last word?


Yes, as you can see AJ is now stuck in a trading range and a small one at that. The long wicks and tails of the candles in the range tell us that the buyers and sellers are in agreement on price and at this time cannot out weigh each other one way or the other.

The immediate trend is up though and the fact that the sellers have failed at taking price lower also tells us something. Any new trades here would be preferred to be long orders with the immediate trend.

When it comes to opportunities on AUD crosses lately, which one would you
consider to be the best and why? Audcad, Audusd?


AUD/CAD was the strongest of the AUD pairs.
Attached Image (click to enlarge)
Click to Enlarge

Name: audjpy10082010.jpg
Size: 96 KB
 
 
  • Post #14,451
  • Quote
  • Oct 8, 2010 8:02pm Oct 8, 2010 8:02pm
  •  extraneo
  • | Joined Oct 2009 | Status: PASR | 304 Posts
Quoting CrudeCraig
Disliked
So you would consider taking trade on this hammer as very risky because
Boss hasn't said his last word?


Yes, as you can see AJ is now stuck in a trading range and a small one at that. The long wicks and tails of the candles in the range tell us that the buyers and sellers are in agreement on price and at this time cannot out weigh each other one way or the other.

The immediate trend is up though and the fact that the sellers have failed at taking price lower also tells us something. Any new trades here would be preferred...
Ignored
are you sure that the immediate trend is up?
Attached Image (click to enlarge)
Click to Enlarge

Name: ajb.gif
Size: 9 KB
 
 
  • Post #14,452
  • Quote
  • Oct 8, 2010 8:14pm Oct 8, 2010 8:14pm
  •  Strat
  • Joined Feb 2009 | Status: 14 YEAR PASR THREAD Senior Member | 11,766 Posts
Quoting geniusztc
Disliked
hello,everyone .

i have learned the thread some time .of course,i do analysis ,and i trade though the charts with my analysis.but ,i just do not know whether is there anything wrong with my homework. in the attachments ,there are some charts with my analysis ,can you give me some of your time and watch my charts .i need your advice and criticism.

thank you very very very much. give my best wishes to all of you .
Ignored
So far I have looked at your USDJPY charts for which you have drawn channels on each time frame - what is the point? USDJPY is in a confirmed down trend - what else do you need to know?

I will check others later
14 YEARS OF PASR ON FOREX FACTORY!
 
 
  • Post #14,453
  • Quote
  • Oct 8, 2010 10:47pm Oct 8, 2010 10:47pm
  •  CrudeCraig
  • | Joined May 2009 | Status: Member | 424 Posts
Quoting extraneo
Disliked
are you sure that the immediate trend is up?
Ignored
Good eye!

Technically because we are in a range you could say that there is no trend on the daily. Remember though that as you go through the TF's there are trends within trends within trends........
 
 
  • Post #14,454
  • Quote
  • Edited 1:05am Oct 9, 2010 12:55am | Edited 1:05am
  •  geniusztc
  • Joined Jun 2010 | Status: Hello,Mr.Market | 1,805 Posts
quote=strat;4084797]So far I have looked at your USDJPY charts for which you have drawn channels on each time frame - what is the point? USDJPY is in a confirmed down trend - what else do you need to know?
I will check others later[/quote]

THANK YOU strat!!!

yes,it is a confirmed down trend,and it has just breakthrough a support line (the lime line).but,however, the price has be close to the historic lows.maybe there is a reverse in the near future,i am not sure.just be careful.

about channels. you do not teach us use the channel line,but i has just observed that the channels are always very useful... i have no more idea about channels.

need your more advice . thank you again.
Attached Image (click to enlarge)
Click to Enlarge

Name: uj.gif
Size: 24 KB
Attached Image
A chart helps those who can read it.
 
 
  • Post #14,455
  • Quote
  • Oct 9, 2010 2:05am Oct 9, 2010 2:05am
  •  extraneo
  • | Joined Oct 2009 | Status: PASR | 304 Posts
Quoting CrudeCraig
Disliked
Good eye!

Technically because we are in a range you could say that there is no trend on the daily. Remember though that as you go through the TF's there are trends within trends within trends........
Ignored

Thanks for your reply
But 'I had posted a weekly chart.
Now place the 3 TF: even on the monthly trend has slowed and, in my opinion, we should expect a retracement (profit taking) and wait for a confirmed swing low.
Attached Image(s) (click to enlarge)
Click to Enlarge

Name: ajbb.gif
Size: 9 KB
Click to Enlarge

Name: ajb.gif
Size: 9 KB
Click to Enlarge

Name: ajw.gif
Size: 9 KB
 
 
  • Post #14,456
  • Quote
  • Oct 9, 2010 5:07am Oct 9, 2010 5:07am
  •  hcristea
  • | Joined Oct 2007 | Status: papa dragon | 293 Posts
Quoting extraneo
Disliked
are you sure that the immediate trend is up?
Ignored
When 20 is crossing 50 you get an early warning that the trend is about to change. I will wait to see a HH-HL-HH sequence before looking for trades within an up trend.

On the Worker 20 has crossed the 50. We have out first HH. Some could consider the latest candle low as a HL but I will wait to see if it is a confrmed HL and wait for another HH before I look for trades.

My feeling is that the immediate trend is UP, but the price is at BB R and Boss R and it can turn down. If price broke through the heavy resistance above then I'll be looking for opportunities to buy.
Attached Image (click to enlarge)
Click to Enlarge

Name: AUDJPY_W_09.10.png
Size: 37 KB
 
 
  • Post #14,457
  • Quote
  • Oct 9, 2010 5:10am Oct 9, 2010 5:10am
  •  Grimweasel
  • | Joined Feb 2008 | Status: Member | 558 Posts
Ref usdyen I see Hugh Hendry was right after all and not 'talking his book'!! Interestingly, (and rather oddly I may add) there was a piece in the FT last weekend where HH said he was trying to open up a short position on China! He said it was proving difficult but was in bubble territory - I don't think I'll follow him on that one!!
Trade less and become more profitable!
 
 
  • Post #14,458
  • Quote
  • Oct 9, 2010 10:08am Oct 9, 2010 10:08am
  •  cameron1st
  • | Joined Aug 2010 | Status: lex parsimoniae | 230 Posts
Hi Strat & guys, <-- Strat & the band ?

Just found this thread, solid info. Busy now, have to catch up on 964 pages.

Laters,

Cam
 
 
  • Post #14,459
  • Quote
  • Oct 9, 2010 12:15pm Oct 9, 2010 12:15pm
  •  Strat
  • Joined Feb 2009 | Status: 14 YEAR PASR THREAD Senior Member | 11,766 Posts
Quoting geniusztc
Disliked
quote=strat;4084797]So far I have looked at your USDJPY charts for which you have drawn channels on each time frame - what is the point? USDJPY is in a confirmed down trend - what else do you need to know?
I will check others later
Ignored
THANK YOU strat!!!

yes,it is a confirmed down trend,and it has just breakthrough a support line (the lime line).but,however, the price has be close to the historic lows.maybe there is a reverse in the near future,i am not sure.just be careful.

about channels. you do not teach us use the channel line,but i has just observed that the channels are always very useful... i have no more idea about channels.

need your more advice . thank you again.[/quote]

Many currency pairs are contained within channels and many traders trade the channels. It is an option to choose if that is a style that fits your trading personality.
14 YEARS OF PASR ON FOREX FACTORY!
 
 
  • Post #14,460
  • Quote
  • Oct 9, 2010 1:33pm Oct 9, 2010 1:33pm
  •  Strat
  • Joined Feb 2009 | Status: 14 YEAR PASR THREAD Senior Member | 11,766 Posts
Quoting geniusztc
Disliked
hello,everyone .

i have learned the thread some time .of course,i do analysis ,and i trade though the charts with my analysis.but ,i just do not know whether is there anything wrong with my homework. in the attachments ,there are some charts with my analysis ,can you give me some of your time and watch my charts .i need your advice and criticism.

thank you very very very much. give my best wishes to all of you .
Ignored
I have studied your USDCHF and all your charts are OK. You should adjust your support on the Worker to the close of that last red candle to reflect current Worker support
14 YEARS OF PASR ON FOREX FACTORY!
 
 
  • Commercial Content
  • /
  • Strat's Long Term Stress Free Trading
  • Reply to Thread
    • 1 721722Page 723724725 1087
    • 1 Page 723 1087
0 traders viewing now
  • More
Top of Page
  • Facebook
  • Twitter
About FF
  • Mission
  • Products
  • User Guide
  • Media Kit
  • Blog
  • Contact
FF Products
  • Forums
  • Trades
  • Calendar
  • News
  • Market
  • Brokers
  • Trade Explorer
FF Website
  • Homepage
  • Search
  • Members
  • Report a Bug
Follow FF
  • Facebook
  • Twitter

FF Sister Sites:

  • Metals Mine
  • Energy EXCH
  • Crypto Craft

Forex Factory® is a brand of Fair Economy, Inc.

Terms of Service / ©2023