• Home
  • Forums
  • Trades
  • News
  • Calendar
  • Market
  • Brokers
  • Login
  • Join
  • User/Email: Password:
  • 7:52pm
Menu
  • Forums
  • Trades
  • News
  • Calendar
  • Market
  • Brokers
  • Login
  • Join
  • 7:52pm
Sister Sites
  • Metals Mine
  • Energy EXCH
  • Crypto Craft

Options

Bookmark Thread

First Page First Unread Last Page Last Post

Print Thread

Similar Threads

Where can I learn more about Price Action like those in James16 charts? 9 replies

  • Commercial Content
  • /
  • Reply to Thread
  • Subscribe

james16 Chart Thread

  • Last Post
  •  
  • 1 38273828Page 382938303831 7162
  • 1 Page 3829 7162
  •  
  • Post #76,561
  • Quote
  • Oct 6, 2010 12:56am Oct 6, 2010 12:56am
  •  supremeChaos
  • Joined Feb 2009 | Status: Borderline yahoo & oh-no! | 6,607 Posts
Quoting supremeChaos
Disliked
what
...

(an alternative: use this indicator to plot lines, then just discard the other lines which u think are unnecessary. adjust the other lines, if u deem necessary. this way, u plot your PPZs, S/Rs much faster, time-wise.)
Ignored
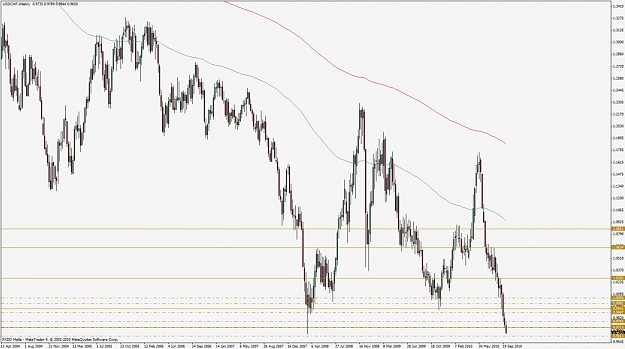
i made a slight modification on that indicator:
the lines created by the indicator will stay on the chart even after u deleted the indicator.

sharing it here, just in case..
Attached File
File Type: mq4 Levels_1.mq4   6 KB | 653 downloads


Quoting Pinbar
Disliked
Yes, SC...
Ignored
i see, thanks.
i think i've seen that indicator on the MQL4 forum before.
  • Post #76,562
  • Quote
  • Oct 6, 2010 12:58am Oct 6, 2010 12:58am
  •  melvin87
  • | Joined Aug 2010 | Status: Member | 84 Posts
Quoting phpscott
Disliked
There would have been a solid close under 1.33 for me to take it. For example, 1.3296 would not cut it.

This is a little more advanced, but if I did place a trade, I would have waited for a decent retracement of of the BEOB before placing my sell stop order at the break of the BEOB. With all those bar highs, a good retracement was almost guaranteed to happen. I do not think I ever missed a trade doing that in this type of situation... YET.

Scott
Ignored
Hey Scott, how many pips below 1.33 would you consider as a solid close?
  • Post #76,563
  • Quote
  • Oct 6, 2010 1:13am Oct 6, 2010 1:13am
  •  Pinbar
  • Joined May 2010 | Status: HCR-LCS SFP | 6,026 Posts
Quoting supremeChaos
Disliked
i made a slight modification on that indicator:
the lines created by the indicator will stay on the chart even after u deleted the indicator.

sharing it here, just in case..
Attachment 556220


i see, thanks.
i think i've seen that indicator on the MQL4 forum before.
Ignored


The point of my question was, what do you guys think of the levels it creates, not really its value.

Any opinions SC?

I was thinking its value may be on a chart where we have an extreme price level where it is hard to find PPZ, such as this USD/CHF.
Attached Images (click to enlarge)
Click to Enlarge

Name: w.jpg
Size: 115 KB Click to Enlarge

Name: d.jpg
Size: 111 KB Click to Enlarge

Name: h4.jpg
Size: 94 KB
  • Post #76,564
  • Quote
  • Oct 6, 2010 1:21am Oct 6, 2010 1:21am
  •  jarroo
  • Joined Sep 2005 | Status: J16 Senior Member | 13,635 Posts
Quoting cprao
Disliked
The reason I was relating EURGBP with EURCHF is becuase - EURGBP has a strong uptrend.. so the BEOB may not have the strength to undo that strong uptrend.

Where as in the case of EURCHF, it is not the case.. the uptrend is not strong..

Both the pairs seem to have good BEOB/DBHLC'S.

As you said, the PA is still in play since the high is not taken out.
Ignored
Oh, I see cprao . .the Eur/Chf is more of a retrace, with the trend-continuation setup . . where the Eur/Gbp is more of a countertrend trade.

Yes, they are still in play since they have not been invalidated. They both have strengths and weaknesses . .definitely ones to follow and see how they turn out.
Indicators show the past. Price Action "Indicates" the future.
  • Post #76,565
  • Quote
  • Oct 6, 2010 1:32am Oct 6, 2010 1:32am
  •  Pinbar
  • Joined May 2010 | Status: HCR-LCS SFP | 6,026 Posts
Quoting jarroo
Disliked
Oh, I see cprao . .the Eur/Chf is more of a retrace, with the trend-continuation setup . . where the Eur/Gbp is more of a countertrend trade.

Yes, they are still in play since they have not been invalidated. They both have strengths and weaknesses . .definitely ones to follow and see how they turn out.
Ignored

Indeed, I would like to see this daily candle form a BEOB Jaroo special off the TL and close below the 50 fibo.
Attached Images (click to enlarge)
Click to Enlarge

Name: picd.jpg
Size: 221 KB Click to Enlarge

Name: 4.jpg
Size: 160 KB
  • Post #76,566
  • Quote
  • Oct 6, 2010 1:35am Oct 6, 2010 1:35am
  •  dmuk
  • | Joined Jan 2010 | Status: Member | 38 Posts
Quoting jarroo
Disliked
From my point of view . if you can understand this chart below . . where Support turns into Resistance once Price breaks through it (and vice versa) and using PA . .either bullish (at Support) or bearish (at Resistance) . . you're ahead of the game. It's a good starting point . .imo
Ignored
Jarroo,

Thanks for the chart:
http://www.forexfactory.com/showpost...ostcount=76471

I do understand it because there are simply two lines plotted on the chart. However my confusion is lying in the fact that the analysis being performed here seems to involve multiple lines of support and resistance and every BRN.

Also, what about price actions and potential trades outside of this "zone"?

Am I best going back to basics and simply plotting support and resistance and watching for price action at these points?
  • Post #76,567
  • Quote
  • Oct 6, 2010 1:37am Oct 6, 2010 1:37am
  •  jarroo
  • Joined Sep 2005 | Status: J16 Senior Member | 13,635 Posts
Quoting Pinbar
Disliked
Indeed, I would like to see this daily candle form a BEOB Jaroo special off the TL and close below the 50 fibo.
Ignored

I would like to see it up by the 1.3500 BRN . .nice locational confluence up there with the fib levels and trendline.
Indicators show the past. Price Action "Indicates" the future.
  • Post #76,568
  • Quote
  • Oct 6, 2010 1:38am Oct 6, 2010 1:38am
  •  The Captain
  • Joined Oct 2009 | Status: Thank You eohater | 790 Posts
Quoting Pinbar
Disliked
Indeed, I would like to see this daily candle form a BEOB Jaroo special off the TL and close below the 50 fibo.
Ignored
Hey PB,

Could be a good setup, but watch out for the lower TL. You'd be better off going short on a break and retest than going short right on the line.

Cheers
Attached Image (click to enlarge)
Click to Enlarge

Name: picd.jpg
Size: 392 KB
Cap
  • Post #76,569
  • Quote
  • Oct 6, 2010 1:43am Oct 6, 2010 1:43am
  •  Pinbar
  • Joined May 2010 | Status: HCR-LCS SFP | 6,026 Posts
Quoting The Captain
Disliked
Hey PB,

Could be a good setup, but watch out for the lower TL. You'd be better off going short on a break and retest than going short right on the line.

Cheers
Ignored

Yes, thanks for the advice Captain.
Before I saw this post I updated with an H4 chart and lower TL, I was thinking the very same thing.
  • Post #76,570
  • Quote
  • Oct 6, 2010 1:46am Oct 6, 2010 1:46am
  •  Pinbar
  • Joined May 2010 | Status: HCR-LCS SFP | 6,026 Posts
Quoting jarroo
Disliked
I would like to see it up by the 1.3500 BRN . .nice locational confluence up there with the fib levels and trendline.
Ignored

Like this?
Attached Image (click to enlarge)
Click to Enlarge

Name: Capture.PNG
Size: 233 KB
  • Post #76,571
  • Quote
  • Oct 6, 2010 1:49am Oct 6, 2010 1:49am
  •  james16
  • | Commercial Member | Joined Feb 2005 | 2,875 Posts
ok good.

the hardest part of this is between your ears and losing at your stage is not a bad thing.

i will tell you why.

the only people that ever make it in this business are almost always those that had the following happen to them.

1. they find a solid method. you have. be very very thankful for that. most search years and never do.

2. they lose early on which causes them to refine, simplify and focus on the best possible set ups they can find. most give up because they lose faith in the method. you have 5 years of proof that the last thing you should do is lose faith in the method your learning.

3. they finally figure out at 2 or 3 great trades a month can easily produce 10 percent or better. the vast majority never get to this point.

4. they dedicate themselves to practice practice and more practice.

it all comes together when there account size is large enough that number 3 is ok with them.

its what happened to me many years ago and its what ive taught and watched happen to countless others.

ive also watched countless others fail.

it took me 8 years before i had a positive year but i had virtually nothing to help me.

i made my own charts in the early 1980's with a newspaper, graph paper,a pencil and a ruler.

seriously.


Quoting geomink
Disliked
Yes I am, Jim

After three months profitable in a row, in september and october I'm dropping just in confusion

So much information to learn, in addition; so I'm feeling just in confusion

Loosing "k.i.s.s." and "Less is more"........

Many thanks for all
Ignored
  • Post #76,572
  • Quote
  • Oct 6, 2010 1:56am Oct 6, 2010 1:56am
  •  jarroo
  • Joined Sep 2005 | Status: J16 Senior Member | 13,635 Posts
Quoting dmuk
Disliked
Jarroo,

Thanks for the chart:
http://www.forexfactory.com/showpost...ostcount=76471

I do understand it because there are simply two lines plotted on the chart. However my confusion is lying in the fact that the analysis being performed here seems to involve multiple lines of support and resistance and every BRN.

Also, what about price actions and potential trades outside of this "zone"?

Am I best going back to basics and simply plotting support and resistance and watching for price action at these points?
Ignored
The heart of this method is at the PPZone. It's where a PA formation is best supported. Sure, there are setups at extreme swing High or Low points that have no BRNs or PPZ levels to support them. They work on sheer size, space and structure. Like the Nov. 07 PB. And they work very well.


My trading is pretty basic . . PPZ levels . .where Support and Resistance meet.

Yes, I would go back to basics of Support and Restance but watch how once a strong level of Support is broke it turns into Resistance (and vice versa) . . . much like that chart.
Attached Image (click to enlarge)
Click to Enlarge

Name: cad07.jpg
Size: 127 KB
Indicators show the past. Price Action "Indicates" the future.
  • Post #76,573
  • Quote
  • Oct 6, 2010 1:57am Oct 6, 2010 1:57am
  •  jarroo
  • Joined Sep 2005 | Status: J16 Senior Member | 13,635 Posts
Quoting Pinbar
Disliked
Like this?
Ignored
Yes . . .lol . .
Indicators show the past. Price Action "Indicates" the future.
  • Post #76,574
  • Quote
  • Oct 6, 2010 1:58am Oct 6, 2010 1:58am
  •  jarroo
  • Joined Sep 2005 | Status: J16 Senior Member | 13,635 Posts
Quoting The Captain
Disliked
Hey PB,

Could be a good setup, but watch out for the lower TL. You'd be better off going short on a break and retest than going short right on the line.

Cheers
Ignored

Support turning into Resistance . .
Indicators show the past. Price Action "Indicates" the future.
  • Post #76,575
  • Quote
  • Oct 6, 2010 2:02am Oct 6, 2010 2:02am
  •  Pinbar
  • Joined May 2010 | Status: HCR-LCS SFP | 6,026 Posts
Jarro, you just inspired me to look at only one PPZ, the weekly.

Does this not mean that if price reaches the 1.3500 BRN we then have a problem of it breaking the weekly PPZ.

Unless of course it closes below it.


EDIT: OK, I see it now, there are actually 2 weekly PPZ close together and the space between them is actually the PPZ.

Now, this rings a Jaroo Bell.

"We like to see PPZ close together"!

Sometimes I fail to see the space between the PPZ and sort of look at hem as individual lines.

I need my eyes to bleed some more, obviously.
Attached Images (click to enlarge)
Click to Enlarge

Name: pic.jpg
Size: 103 KB Click to Enlarge

Name: w.jpg
Size: 87 KB
  • Post #76,576
  • Quote
  • Oct 6, 2010 2:08am Oct 6, 2010 2:08am
  •  The Captain
  • Joined Oct 2009 | Status: Thank You eohater | 790 Posts
Quoting jarroo
Disliked
Support turning into Resistance . .
Ignored
Cap
  • Post #76,577
  • Quote
  • Oct 6, 2010 2:12am Oct 6, 2010 2:12am
  •  jarroo
  • Joined Sep 2005 | Status: J16 Senior Member | 13,635 Posts
Quoting Pinbar
Disliked
Jarro, you just inspired me to look at only one PPZ, the weekly.

Does this not mean that if price reaches the 1.3500 BRN we then have a problem of it breaking the weekly PPZ.

Unless of course it closes below it.
Ignored
It is a proven PPZ level at a strong BRN, 1.3500. I can see it acting as strong Resistance . .the chart is what I would like to see . .


But if Price pushes through the 1.3500 I can easily see it acting as strong Support.
Attached Image (click to enlarge)
Click to Enlarge

Name: eurchf07.jpg
Size: 93 KB
Indicators show the past. Price Action "Indicates" the future.
  • Post #76,578
  • Quote
  • Edited at 2:28am Oct 6, 2010 2:17am | Edited at 2:28am
  •  jarroo
  • Joined Sep 2005 | Status: J16 Senior Member | 13,635 Posts
Quoting Pinbar
Disliked
Jarro, you just inspired me to look at only one PPZ, the weekly.

Does this not mean that if price reaches the 1.3500 BRN we then have a problem of it breaking the weekly PPZ.

Unless of course it closes below it.


EDIT: OK, I see it now, there are actually 2 weekly PPZ close together and the space between them is actually the PPZ.

Now, this rings a Jaroo Bell.

"We like to see PPZ close together"!

Sometimes I fail to see the space between the PPZ and sort of look at hem as individual lines.

I need my eyes to bleed some more, obviously....
Ignored
That looks good , Pb . .


BTW . .have you seen the Usd/Cad this week? . . .nice analysis you had on that last week, Pb . . .

Quoting Pinbar
Disliked
Hi, Maarc and welcome to this Great thread.


Yes, you are wrong in as much as PINBAR is not a senior, just an earnest newbie.


I think this area is problematic, in as much as, a weekly bearish PB type bar just closed. It is not a valid bearish PB PA bar but it is a bearish bar by nature of the close. The close is sitting right on the RN. I think the area we are at on the daily with all those lows lining up is a possible flip area in the making. We want to see any bullish PA close above that area on the daily and any bearish PA come off it....
Ignored
Indicators show the past. Price Action "Indicates" the future.
  • Post #76,579
  • Quote
  • Oct 6, 2010 2:20am Oct 6, 2010 2:20am
  •  jarroo
  • Joined Sep 2005 | Status: J16 Senior Member | 13,635 Posts
Quoting james16
Disliked
ok good.

the hardest part of this is between your ears and losing at your stage is not a bad thing.

i will tell you why.

the only people that ever make it in this business are almost always those that had the following happen to them.

1. they find a solid method. you have. be very very thankful for that. most search years and never do.

2. [b]they lose early on which causes them to refine, simplify and focus on the best possible set ups they can find. most give up because they lose faith in the method. you have 5 years of proof that the...
Ignored

I don't know how you did it. . .graph paper, etc . .lol . .wow

You must have some drive in you, my friend.
Indicators show the past. Price Action "Indicates" the future.
  • Post #76,580
  • Quote
  • Oct 6, 2010 2:27am Oct 6, 2010 2:27am
  •  Pinbar
  • Joined May 2010 | Status: HCR-LCS SFP | 6,026 Posts
Quoting jarroo
Disliked
That looks good , Pb . .


BTW . .have you seen the Usd/Cad this week? . . .nice analysis you had on that last week, Pb . . .
Ignored
Yeah, I saw the small PB then the Jarroo special BEOB PB.

They sure do work well.

Just shows that size is a major factor in PA.
Attached Image (click to enlarge)
Click to Enlarge

Name: pic.jpg
Size: 220 KB
  • Commercial Content
  • /
  • james16 Chart Thread
  • Reply to Thread
    • 1 38273828Page 382938303831 7162
    • 1 Page 3829 7162
0 traders viewing now
  • More
Top of Page
  • Facebook
  • Twitter
About FF
  • Mission
  • Products
  • User Guide
  • Media Kit
  • Blog
  • Contact
FF Products
  • Forums
  • Trades
  • Calendar
  • News
  • Market
  • Brokers
  • Trade Explorer
FF Website
  • Homepage
  • Search
  • Members
  • Report a Bug
Follow FF
  • Facebook
  • Twitter

FF Sister Sites:

  • Metals Mine
  • Energy EXCH
  • Crypto Craft

Forex Factory® is a brand of Fair Economy, Inc.

Terms of Service / ©2021