I, however, I did not take the trade because it was against the trend (weekly BUOB: PA against immediate trend)
Ignored
I'm not sure how you find out that the trend is bullish. It is indeed a Weekly BUOB but it closed weak - tested 1.6 and closed well below. I wouldn't take things as black & white like if last week was a buob it means the immediate trend is bullish. Context is also important, how it closed, where it closed, how does BB look like etc...
Trading = a mirror to your human flaws. Fix them or be fixed.
I'm not sure how you find out that the trend is bullish. It is indeed a Weekly BUOB but it closed weak - tested 1.6 and closed well below. I wouldn't take things as black & white like if last week was a buob it means the immediate trend is bullish. Context is also important, how it closed, where it closed, how does BB look like etc...
Ignored
I understand that the long term trend is bearish, but, as the TEACHER says, there is a conflict between Boss (up) and BIG BOSS (down).
I also understand that the rejection of 1.6000 may be tempting, but Strat has taught me to do not risk trading.
Hi behman, in this thread are taught to fish
therefore, no indicators
Ignored
In this thread there are 20 and 50 indis. I also have 200 ema just to confirm whether it is above or below 200. I have a Trendlord from FF here , its additional Confirmation for me. I trade only longterm looking at big boss, boss, and worker n take my clue from that. To each his own. Thank you, wish you all of us lots of pips. lol Peace in this world, especially fx World! LOL
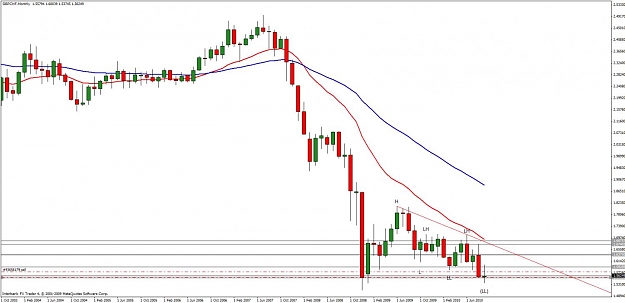
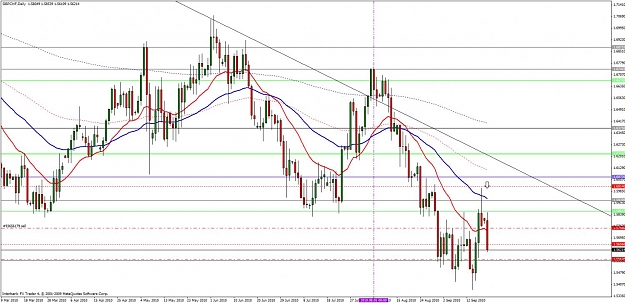
Big Boss, Boss and Worker are aligned (the swing low of last week has not been confirmed).
The price has been rejected by 1.6200ish downward.
A close below 1.6000 would be good.
Major obstacle to 1.5900, and then 1.5792ish 1.5700ish.
Candle long, and possible profit taking after the close of this candle.
Use caution, perhaps putting BE into 1.5900 area.
Hi behman, in this thread are taught to fish
therefore, no indicators
Ignored
Forget him. He will die like everyone relying on indicators. He will get caught out big time when he realises that his TrendLord piece of shit REPAINTS - and REPAINTS like crazy!
Now this is where I ALWAYS get into trouble....
To move, or not to move?
One remaining position with my plan to have PA on the daily dictate the close.
Great plan, but it presupposes that I can actually recognize - and correctly interpret - PA on the daily!!
Following big bull bar of 15 Sept, we have IB/hanging man on the 16th (signal to tighten?). Then we have SS on the 17th (which failed to break the high of 15 Sept). Have sunday bar 18th as another IB and today upside break of sunday's bar, though we...
Ignored
I couldn't help but to respond to this one. Many will remember that the related market A/J has been a friend of mine from the long side for some time. Looking to short this one countervenes most of the long term theories espoused on this thread. Though Strat states (correctly) that one should follow the footprints in the JPY pairs, the missing corollary is that the footprints have been apparent in this market for some time. Today's price action is very reassuring.
This was a setup that looked very convincing from the first viewing before doing any analyzing.
Reasoning for taking the trade:
Boss- despite being a green bar, was in the form of a spinning top with long upper and lower wicks indicating lack of conviction by both buyers and sellers. Not strong point.
However did make an unconfirmed LL.
Both EMAs down, and diverging, indicating price should move lower.
Trends: dominant, down; intermediate, down; short term, down; immediate, weakly up (see above) but ready for reversal.
In my view an easy CT trade, against a very weak boss immediate trend.
A CT short trade at this point would bring all 4 trends back into sync.
Big Boss- Almost identical to Boss.
Worker PASR:
i) true well formed SS
ii) 50 EMA tested and rejected, close of setup bar inside Strat shadow, but the entry trigger point 10 pips below the SS low, would put price just below the Strat shadow; an excellent entry point for a short trade.
iii) SS tested and rejected R at 1.5929
Entry: 1.5756
Stop Loss: 1.6014 (10 pips above SS high)
TP1 (+100 pips) 1.5656; TP2 (key level adjusted above S on all TFs of 1.5555) 1.5562
Risk: 258 pips
Pip Value: 0.10
Trade risk: (risk x pip value) USD25.80
Account: 9500, 1% = USD95
Account risk: (% of account/trade risk) = 3.6 microlots. Therefore 3 tranches of 1 microlot.
Note: Normally I would risk 2%, but as this was my first time to do a CT trade with an SS as the setup bar I decided that it would be prudent to risk only 1%
Day 1: short trade triggered, TP1 achieved, SL moved to BE, well on the way to 2nd TP, now a free trade.
Attached Image(s) (click to enlarge)
"Make everything as simple as possible, but not simpler" Albert Einstein
I couldn't help but to respond to this one. Many will remember that the related market A/J has been a friend of mine from the long side for some time. Looking to short this one countervenes most of the long term theories espoused on this thread. Though Strat states (correctly) that one should follow the footprints in the JPY pairs, the missing corollary is that the footprints have been apparent in this market for some time. Today's price action is very reassuring.
Ignored
Thanks for your post Alexandra.
I don't want to appear intentionally dense (it's not intentional but congenital! ), but I presume your comment: " Looking to short this one countervenes most of the long term theories espoused on this thread." is referring to NZD/JPY pair (rather than AUD/JPY)?
The point of my post that you responded to was not whether I should take a short on the basis of the ss/double top but whether correct trade managment of an existing long would be to
1.raise the stop under the SS 17th or
2. raise stop under the hanging man 16th or
3. leave stop at entry stop.
I am not planning to short.
Attached Image
Finally, when you say: "Today's price action is very reassuring." I assume you mean the candle 2oth as a BUOB?
Big Boss, Boss and Worker are aligned (the swing low of last week has not been confirmed).
The price has been rejected by 1.6200ish downward.
A close below 1.6000 would be good.
Major obstacle to 1.5900, and then 1.5792ish 1.5700ish.
Candle long, and possible profit taking.
Use caution, perhaps putting BE into 1.5900 area.
Ignored
Hi extraneo,
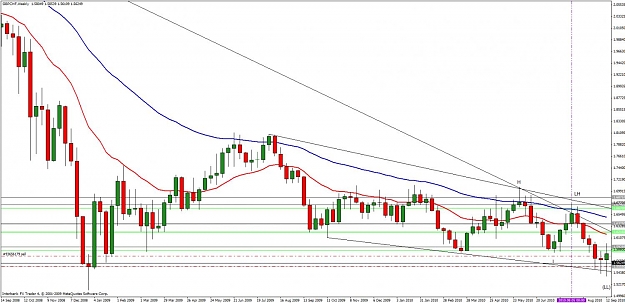
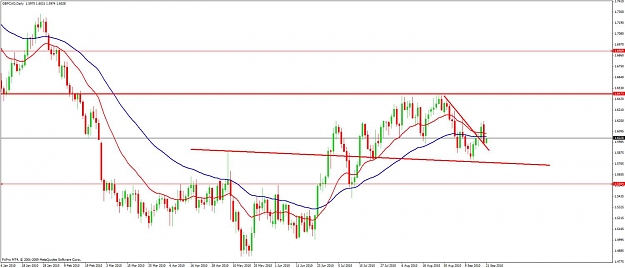
The first thing i noticed is your SR placement is off see my chart below to clear your lines so that you are focusing on the important Boss SR only.
Second is what your MA's are telling us. Them being flat like they are tell us that there is no momentum to the north or south at the moment. I personally see a range forming on this pair between 1.6500 and 1.5565
Third this bar did not form at an important level it's just floating out there.
I would proceed with caution, it could very well prove to be a profitable trade but the risk associated with it is not worth it IMO. And i have been burned by the same kind of trade a few times and learned my lesson there.
Also please change the backround color of your charts to white when you post them and your 20 ema should be red and your 50 blue to be consistent and easy to look at when replying to others posts.
Thanks for your post Alexandra.
I don't want to appear intentionally dense (it's not intentional but congenital! ), but I presume your comment: " Looking to short this one countervenes most of the long term theories espoused on this thread." is referring to NZD/JPY pair (rather than AUD/JPY)?
The point of my post that you responded to was not whether I should take a short on the basis of the ss/double top but whether correct trade managment of an existing long would be to
1.raise the stop under the SS 17th or
2. raise stop under the hanging...
Ignored
As mentioned in my PM to you, I was pointing at the AUDJPY chart. On that one, the close for the moment is supportive vis a vis the weekly and monthly resistance. Stops are a personal matter, but given the rise in that market, I have mine under the lows of 9/15. We'll se how the week closes.
hello house,been a while i posted on here,great work you guys are doing here.i just need some advice,i trade 3 currencies,AUDUSD,GBPUSD and EURUSD,the problem is i get confused on which of the 3 to trade some times if the 3 pairs are given same signal,recently the 3 pairs were giving a buy signal same time ,so i chose to go for AUDUSD but i discovered other pairs moved more than the pair i took,i get confused often times making this same mistakes,what do you advice? may be i should just try to spread my money on the 3 pairs per time when i am trading or what do you guys think?any advice is highly appreciated.
hello house,been a while i posted on here,great work you guys are doing here.i just need some advice,i trade 3 currencies,AUDUSD,GBPUSD and EURUSD,the problem is i get confused on which of the 3 to trade some times if the 3 pairs are given same signal,recently the 3 pairs were giving a buy signal same time ,so i chose to go for AUDUSD but i discovered other pairs moved more than the pair i took,i get confused often times making this same mistakes,what do you advice? may be i should just try to spread my money on the 3 pairs per time when i am trading...
Ignored
Since they are all USD$ I would only trade the strongest of the three regardless of how much one COULD move over the other. It sounds like your little people are getting to you (They want more PIPS) so kick them to the side and continue to take the most stress free trades that these three pairs offer you.
hello house,been a while i posted on here,great work you guys are doing here.i just need some advice,i trade 3 currencies,AUDUSD,GBPUSD and EURUSD,the problem is i get confused on which of the 3 to trade some times if the 3 pairs are given same signal,recently the 3 pairs were giving a buy signal same time ,so i chose to go for AUDUSD but i discovered other pairs moved more than the pair i took,i get confused often times making this same mistakes,what do you advice? may be i should just try to spread my money on the 3 pairs per time when i am trading...
Ignored
As Craig correctly stated, you have all your eggs in one basket with this strategy. You had better be damn good at getting the direction right otherwise you will get triple losses. Your question is more of volatility than anything else. On any given day, GBPUSD is the most volatile, followed by EURUSD and then AUDUSD BUT, whether they move each time with that volatility depends on the daily agenda of the big boys. More important is that you are subjecting yourself to unwanted stress by always trying to find the biggest mover. You will never find the biggest mover on a day to day basis unless you have access to the big boys’ daily agenda. You are clearly under the CONTROL of your GREEDY Little People. You need to address them FIRST before anything else otherwise they will drag you down. I do not recommend your strategy but if you do, the wisest choice is to spread your trades evenly across the 3 pairs. If you thought like a professional instead of a rank amateur, you would know your strategy is doomed.
hello house,been a while i posted on here,great work you guys are doing here.i just need some advice,i trade 3 currencies,AUDUSD,GBPUSD and EURUSD,the problem is i get confused on which of the 3 to trade some times if the 3 pairs are given same signal,recently the 3 pairs were giving a buy signal same time ,so i chose to go for AUDUSD but i discovered other pairs moved more than the pair i took,i get confused often times making this same mistakes,what do you advice? may be i should just try to spread my money on the 3 pairs per time when i am trading...
Ignored
Your trade plan should tell you which of the three to trade......provided you HAVE a trade plan.
The first thing i noticed is your SR placement is off see my chart below to clear your lines so that you are focusing on the important Boss SR only.
Second is what your MA's are telling us. Them being flat like they are tell us that there is no momentum to the north or south at the moment....
Ignored
Ok, I changed the colors, so we understand each other better.
The reasons for taking the trade:
1) Boss, Big Boss and Worker are aligned;
2) primary trend down;
3) strong rejection from 1.6200 with PA;
4) bouncing down the trendline (calculated at close) bearish on August 26.