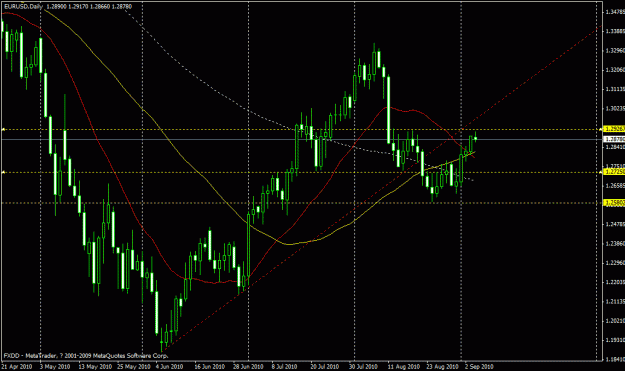
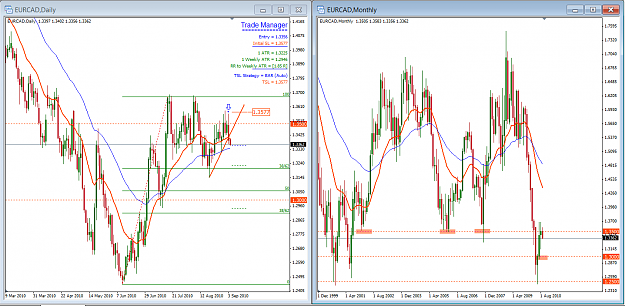
• Home
  • Forums
  • Trades
  • News
  • Calendar
  • Market
  • Brokers
  • Login
  • Join
  • User/Email: Password:
  • 7:03pm
Menu
  • Forums
  • Trades
  • News
  • Calendar
  • Market
  • Brokers
  • Login
  • Join
  • 7:03pm
Sister Sites
  • Metals Mine
  • Energy EXCH
  • Crypto Craft

Options

Bookmark Thread

First Page First Unread Last Page Last Post

Print Thread

Similar Threads

Strat's PASR Long Term, Stress Free Trading 16,477 replies

M5 PASR Trend Trading Strat 95 replies

What you need for trading: indis, a strat & good music 27 replies

Another way to stress free, mechanic long term trading 29 replies

Short Term / Medium Term / Long Term? 3 replies

  • Commercial Content
  • /
  • Reply to Thread
  • Subscribe
  • 8,452
Attachments: Strat's Long Term Stress Free Trading
Exit Attachments
Tags: Strat's Long Term Stress Free Trading
Cancel

Strat's Long Term Stress Free Trading

  • Last Post
  •  
  • 1 688689Page 690691692 1087
  • 1 Page 690 1087
  •  
  • Post #13,781
  • Quote
  • Sep 4, 2010 3:45pm Sep 4, 2010 3:45pm
  •  simpleman
  • | Joined Mar 2010 | Status: Member | 786 Posts
Quoting kalvind
Disliked
The Boss has just shown back to back hammer or bond candles which have yet to be confirmed. The Boss MA' are undecided but there is a down cycle which needs confirmation if it is an intermediate bottom to this cycle as the last two Boss candles are showing.
However the TL down both on the Boss & Worker has been respected but I would wait to see what the last two Boss candles reveal and see what happens around 80 level if it gets down there?
Ignored
That's correct, I have both the bars in my mind. It has broken 80 on several occassions and likely will do that again and as we know PA is King.
 
 
  • Post #13,782
  • Quote
  • Sep 4, 2010 6:12pm Sep 4, 2010 6:12pm
  •  No1Optimist
  • | Joined Jan 2010 | Status: Member | 152 Posts
Quoting strat
Disliked
Right on, Spinner - Oil & Gas are very heavy manipulated as I found out to my detriment and cost - bastards!
Ignored
If you think oil and gas are heavily manipulated, you should have a go at trading cotton or pork belly futures; they are much worse.

I gave up years ago to trade FX, mainly because of this problem
"Make everything as simple as possible, but not simpler" Albert Einstein
 
 
  • Post #13,783
  • Quote
  • Sep 5, 2010 9:50am Sep 5, 2010 9:50am
  •  Grimweasel
  • | Joined Feb 2008 | Status: Member | 558 Posts
I'd agree Flem with all the above. Natty Gas is a sod to trade and the guys that trade it and other commods are experts in the ONE commod that they trade. They have twitter accounts and other comms methods that circumnavigate the normal procedures and it's all about who hears first etc. I had my ass burnt on trading natty gas in futures and via ETFs - then I thought why bother when there will more than likely be a better trade setting up in FX?

I think if you are going to trade a commod then become an expert on that alone maybe? Otherwise stick with FX and Indices!!
Trade less and become more profitable!
 
 
  • Post #13,784
  • Quote
  • Sep 5, 2010 1:10pm Sep 5, 2010 1:10pm
  •  Rubens PP
  • | Joined Mar 2010 | Status: Member | 173 Posts
Quoting extraneo
Disliked
Gbp/Usd: Monthly and Weekly bearish.
I expect bearish PASR to retest area 1.5500 with target 1.5240.
Ignored
Sounds good.. I'd say more like 1.52ish though.
How about EURJPY any thoughts on that?

Greek Bouncer
 
 
  • Post #13,785
  • Quote
  • Sep 5, 2010 3:30pm Sep 5, 2010 3:30pm
  •  JudyLA
  • | Joined Sep 2008 | Status: Member | 6 Posts
Because I like Strat's rambles I have to post.
Here is my EC chart. I plan a trade on Monday.
Plan:
Entry at 13350 because of BEO, close bellow 20, confirmed LH, bearish control candle on weekly
SL=13620 (-270pips)
T1 = 13220 (130pips)
T2 = 13020 (330pips)

Any comments welcome.
J.
Attached Image (click to enlarge)
Click to Enlarge

Name: ecff20100905.gif
Size: 24 KB
 
 
  • Post #13,786
  • Quote
  • Sep 5, 2010 4:01pm Sep 5, 2010 4:01pm
  •  Yebisu
  • | Joined Nov 2009 | Status: Member | 32 Posts
I see the pound kiwi is coming down to touch its trendline again - I will be watching for some price action here. Sorry about the crappy chart - I am sneeking a peek at work......
Attached Image (click to enlarge)
Click to Enlarge

Name: lbkiwi.png
Size: 7 KB
 
 
  • Post #13,787
  • Quote
  • Sep 5, 2010 8:54pm Sep 5, 2010 8:54pm
  •  MoneyMaker
  • | Joined Jun 2009 | Status: Learning to fish.... | 92 Posts
Depending on how my Sunday bar closes will determine if I'll place an orders on this one, but will be one I'm watching. BB and B are still both down and not showing any signs of stopping just yet. Unless I missed something of course, which is very well likely.
Comments as always are more than welcome. As a matter of fact, highly encouraged.
Attached Image (click to enlarge)
Click to Enlarge

Name: gbpjpy daily 9-05-10.gif
Size: 37 KB
 
 
  • Post #13,788
  • Quote
  • Sep 5, 2010 9:01pm Sep 5, 2010 9:01pm
  •  Strat
  • Joined Feb 2009 | Status: 14 YEAR PASR THREAD Senior Member | 11,775 Posts
Quoting JudyLA
Disliked
Because I like Strat's rambles I have to post.
Here is my EC chart. I plan a trade on Monday.
Plan:
Entry at 13350 because of BEO, close bellow 20, confirmed LH, bearish control candle on weekly
SL=13620 (-270pips)
T1 = 13220 (130pips)
T2 = 13020 (330pips)

Any comments welcome.
J.
Ignored
Watch out for S at 1.3265
14 YEARS OF PASR ON FOREX FACTORY!
 
 
  • Post #13,789
  • Quote
  • Sep 5, 2010 11:34pm Sep 5, 2010 11:34pm
  •  LarryK
  • | Joined May 2009 | Status: Member | 311 Posts
Quoting MoneyMaker
Disliked
Depending on how my Sunday bar closes will determine if I'll place an orders on this one, but will be one I'm watching. BB and B are still both down and not showing any signs of stopping just yet. Unless I missed something of course, which is very well likely.
Comments as always are more than welcome. As a matter of fact, highly encouraged.
Ignored
I don't see any SR lines on your chart so what is going to help you decide direction of your trade if any?

You should have S in the 128.5 zone which is quite strong so a strong close below that would be the time to go short. Suitable PA at S would be the reason to go long, in the meantime you can keep your money in the bank!

Larry
 
 
  • Post #13,790
  • Quote
  • Sep 6, 2010 12:26am Sep 6, 2010 12:26am
  •  patrick25
  • | Joined Jul 2007 | Status: Member | 805 Posts
Quoting strat
Disliked
Watch out for S at 1.3265
Ignored
And U.S holiday, I would wait after holiday to consider any trade.
 
 
  • Post #13,791
  • Quote
  • Sep 6, 2010 1:05am Sep 6, 2010 1:05am
  •  MoneyMaker
  • | Joined Jun 2009 | Status: Learning to fish.... | 92 Posts
Quoting LarryK
Disliked
I don't see any SR lines on your chart so what is going to help you decide direction of your trade if any?

You should have S in the 128.5 zone which is quite strong so a strong close below that would be the time to go short. Suitable PA at S would be the reason to go long, in the meantime you can keep your money in the bank!

Larry
Ignored

I have 3 levels from the BB and B charts marked on my chart. Those are the areas I see on my chart when I look further to the left. Not sure what you see on your chart, as I use my Mark 1 eyes.
 
 
  • Post #13,792
  • Quote
  • Sep 6, 2010 1:05am Sep 6, 2010 1:05am
  •  Kolvekal
  • | Additional Username | Joined Dec 2009 | 96 Posts
Good morning (where I am),
I hope to be a student of this system and have started to read the important documents, learn the terms. Should I live so long, then I will read the whole thread also.

I have learned the vital bars or at least thought so until I saw the post with 'PIN BARS' and the reply that we do not use PBs here.

I thought that the 'hammer' 'hanging man' were pin bars and I can accept that they may not be referred to in that fashion on this thread.

Any elucidation would be appreciated.

Kolin
 
 
  • Post #13,793
  • Quote
  • Sep 6, 2010 2:21am Sep 6, 2010 2:21am
  •  Lotuselanman
  • | Joined Apr 2009 | Status: Member | 203 Posts
Quoting Kolvekal
Disliked
Good morning (where I am),
I hope to be a student of this system and have started to read the important documents, learn the terms. Should I live so long, then I will read the whole thread also.

I have learned the vital bars or at least thought so until I saw the post with 'PIN BARS' and the reply that we do not use PBs here.

I thought that the 'hammer' 'hanging man' were pin bars and I can accept that they may not be referred to in that fashion on this thread.

Any elucidation would be appreciated.

Kolin
Ignored
If you are reading the thread - and you should be - you will find that the term PIN BARS comes largely from J16. Hammer, Shooting Stars, Hanging Man are indeed all PIN bars but the using and identifying the correct term enables you to see the difference between them. They have different meanings for Price Action depending on where they are located on the chart. We ONLY use them at points of Support and/or Resistance - hence PASR.
Search the thread, Google the terms but find out what they MEAN for Price Action. Do not trade until you have sorted these out.
 
 
  • Post #13,794
  • Quote
  • Sep 6, 2010 5:46am Sep 6, 2010 5:46am
  •  soso
  • Joined Aug 2007 | Status: Fluid | 1,133 Posts
Quoting JudyLA
Disliked
Because I like Strat's rambles I have to post.
Here is my EC chart. I plan a trade on Monday.
Plan:
Entry at 13350 because of BEO, close bellow 20, confirmed LH, bearish control candle on weekly
SL=13620 (-270pips)
T1 = 13220 (130pips)
T2 = 13020 (330pips)

Any comments welcome.
J.
Ignored
I've actually put a SHORT order here too. In addition I'd like to emphasize the long term outlook. Both Weekly and Monthly are bearish.
Note the Monthly chart, if you look at the past 3 monthly candles (including August) price didn't manage to close above 1.35. This says something about 1.35. Then scroll back to 2002, 2006 and 2007 for further confirmation of the power of 1.35 level.

EDIT: I find that Big Round Numbers (or Psycho Numbers) are very important, many times are the most powerful S/R levels, and easy to identify. There was a statistical study about order flow near round numbers in FX markets (I have to dig for the link but I remember being referenced on FF threads also) that emphasized the clustering of orders near these levels thus generating powerful S/R levels. The "advantage" of these S/R levels is that they are fixed and are seen & used by everybody.
Attached Image (click to enlarge)
Click to Enlarge

Name: eurcuad.png
Size: 106 KB
Trading = a mirror to your human flaws. Fix them or be fixed.
 
 
  • Post #13,795
  • Quote
  • Sep 6, 2010 6:11am Sep 6, 2010 6:11am
  •  Spinner
  • | Joined Sep 2009 | Status: Member | 194 Posts
Quoting soso
Disliked
I've actually put a SHORT order here too. In addition I'd like to emphasize the long term outlook. Both Weekly and Monthly are bearish.
Note the Monthly chart, if you look at the past 3 monthly candles (including August) price didn't manage to close above 1.35. This says something about 1.35. Then scroll back to 2002, 2006 and 2007 for further confirmation of the power of 1.35 level.

EDIT: I find that Big Round Numbers (or Psycho Numbers) are very important, many times are the most powerful S/R levels, and easy to identify. There was a statistical...
Ignored
Maybe a bit of Rubber Band effect on Monthly?
Spinner 'Tis in the Waiting.....
 
 
  • Post #13,796
  • Quote
  • Sep 6, 2010 6:24am Sep 6, 2010 6:24am
  •  Kolvekal
  • | Additional Username | Joined Dec 2009 | 96 Posts
Quoting Lotuselanman
Disliked
If you are reading the thread - and you should be ... using and identifying the correct term enables you to see the difference between them.
Ignored
I did rather think that the answer was just that, thank you. I had previously only concerned myself with shooting stars but now I have 'collected' the SLTSFT set of candles.

Yes, I am on the thread reading it bit by bit and although I am not totally uneducated in Forex terms, the 'thread' term for the item helps to differentiate them for me.

I will demo according to my understanding of the system as I believe that this will re-inforce my learning.

Thanks for your help.

Kolin
 
 
  • Post #13,797
  • Quote
  • Sep 6, 2010 6:33am Sep 6, 2010 6:33am
  •  soso
  • Joined Aug 2007 | Status: Fluid | 1,133 Posts
Quoting Spinner
Disliked
Maybe a bit of Rubber Band effect on Monthly?
Ignored
Hey Spinner, nothing is excluded, I hope I can bag some pips in case it wants to go to the Monthly 20.
Trading = a mirror to your human flaws. Fix them or be fixed.
 
 
  • Post #13,798
  • Quote
  • Sep 6, 2010 9:40am Sep 6, 2010 9:40am
  •  kalvind
  • | Joined Jul 2010 | Status: Member | 65 Posts
Quoting soso
Disliked
I've actually put a SHORT order here too. In addition I'd like to emphasize the long term outlook. Both Weekly and Monthly are bearish.
Note the Monthly chart, if you look at the past 3 monthly candles (including August) price didn't manage to close above 1.35. This says something about 1.35. Then scroll back to 2002, 2006 and 2007 for further confirmation of the power of 1.35 level.
Ignored
For a long term outlook the BB is bearish just by looking at it's MA's. I don't understand your timing though? If you look at the B there is a controlling bar set some eight weeks ago, since then it has been going sideways and the price is arounf 50% retracement of this bar? I have drawn two TL's on the B and these are at an interesting juncture. I would wait for the B to be in harmony with the BB.
As you have stated that the worker is in agreement with the BB but the odd one out is the B? Is this still a long term short from this point, I think the B has yet to tell us?
Attached Image (click to enlarge)
Click to Enlarge

Name: eurcadw_ksd_0609.gif
Size: 44 KB
 
 
  • Post #13,799
  • Quote
  • Sep 6, 2010 9:54am Sep 6, 2010 9:54am
  •  soso
  • Joined Aug 2007 | Status: Fluid | 1,133 Posts
Quoting kalvind
Disliked
For a long term outlook the BB is bearish just by looking at it's MA's....
Attachment 538868
Ignored
Hey kalvind, the B might be a bit rangy indeed. But look at the low of your controlling candle, it is at ~1.3, 300+ pips distance as of now. Way enough to pull the SL to BE and take profit on first 3rd. Or take full profit if you think is the bottom of the range. I favor the continuation.

Cheers,
-soso
Trading = a mirror to your human flaws. Fix them or be fixed.
 
 
  • Post #13,800
  • Quote
  • Sep 6, 2010 9:54am Sep 6, 2010 9:54am
  •  Activer
  • | Joined Dec 2007 | Status: Member | 47 Posts
HI Strat:

At this moment , I'm confused. Because in the big picture of the Daily, the Price is going up,but on the small picture when I watching the MAs, The price up cross the MA 20,and the MA50 is the support. Price is testing the R. Does this a good time to go short?

SL: the high of the last swing , 1.2930
1st TP: 1.2725
2st TP: 1.2590
Attached Image (click to enlarge)
Click to Enlarge

Name: eu.gif
Size: 23 KB
Try to understand English Try to understand Forex
 
 
  • Commercial Content
  • /
  • Strat's Long Term Stress Free Trading
  • Reply to Thread
    • 1 688689Page 690691692 1087
    • 1 Page 690 1087
0 traders viewing now
  • More
Top of Page
  • Facebook
  • Twitter
About FF
  • Mission
  • Products
  • User Guide
  • Media Kit
  • Blog
  • Contact
FF Products
  • Forums
  • Trades
  • Calendar
  • News
  • Market
  • Brokers
  • Trade Explorer
FF Website
  • Homepage
  • Search
  • Members
  • Report a Bug
Follow FF
  • Facebook
  • Twitter

FF Sister Sites:

  • Metals Mine
  • Energy EXCH
  • Crypto Craft

Forex Factory® is a brand of Fair Economy, Inc.

Terms of Service / ©2023