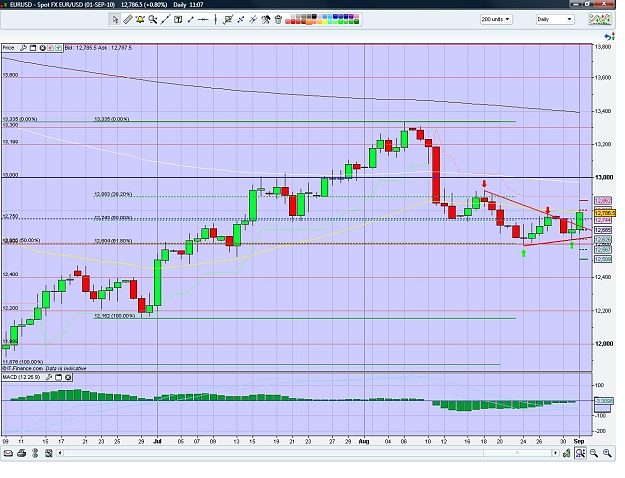
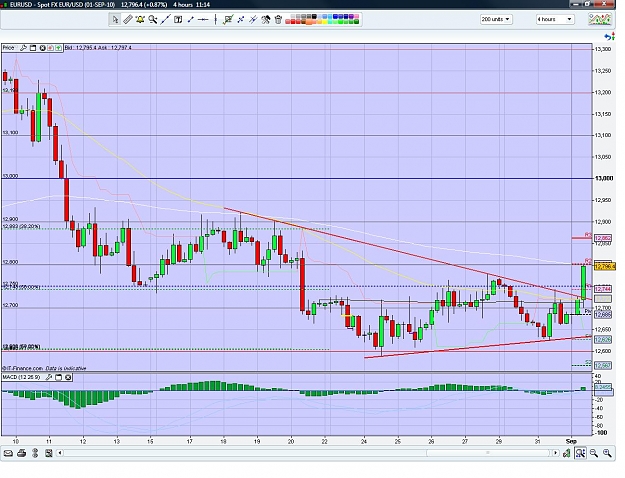
Well I see it as a daily setup but I won't trade it exclusively on the daily chart. I droped down a timeframe to the 4 hour and entered on the break of the break of the first bearish bar. This is generally how I trade ranges.
Stoploss above the high and target near the low of the range.
Cheers
Ignored
Stopped out here for a -1% loss. Winning and losing; part of the game.
This is what worked for me,
-Right-click on the cell and insert Comment
-Right-click on the border of the comment and click "Format Comment"in the menu.
-Choose the Colors and Lines tab, fill section, click the drop-down for Color
-Choose Fill Effects, in Picture , then 'Select Picture'
-Choose your picture and click Insert and click OK
- When you move your mouse over that cell with the comment, it will show your image.When you move out, automatically disappears( just like a comment)
Looking at the exact same confluence zones. Anyway, the video is currently rendering and processing, i'll post it up once its done for your viewing pleasure.
Ignored
Excellent videos Ace, Really enjoying them
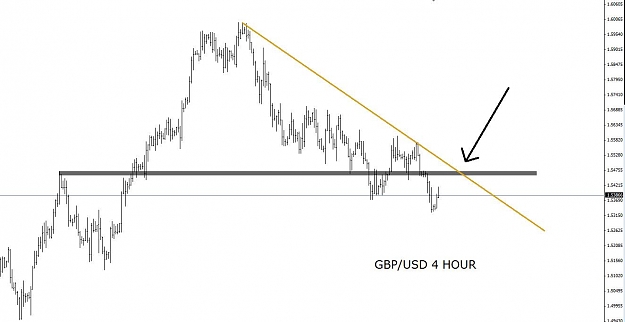
Would this be one of your areas of interest? Curious to see if I'm getting it right
Would this be one of your areas of interest? Curious to see if I'm getting it right
Jonny
Ignored
The horizontal support looks good.
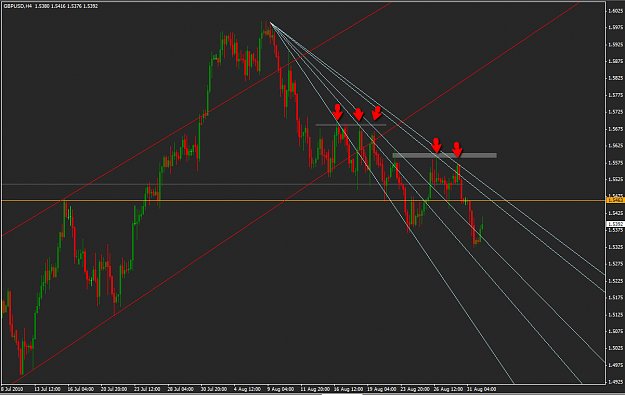
I'm rather picky when it comes to drawing trendlines. I personally wouldn't draw the downward trendline the way you have. I'll try to explain. If you look at the chart there have been numerous lower highs after that extreme high point. If you had followed the market then you would have most likely changed your trendline quite a few times if you connected the extreme high with subsequent lower highs.
This is just my opinion, but that to me suggests that the trendline is not that significant. You don't necessarily have to use the extreme high as the first point. Currently I don't see any trendline that is too significant on this pair (most powerful TL is the equadistant one).
It's somewhat difficult to explain and I hope I'm not confusing you but believe it or not the way you draw a trend line is quite important when looking for the best setups.
If the trade does break short after that zone, it would most likely be because of the horizontal support.
I'm rather picky when it comes to drawing trendlines. I personally wouldn't draw the downward trendline the way you have. I'll try to explain. If you look at the chart there have been numerous lower highs after that extreme high point. If you had followed the market then you would have most likely changed your trendline quite a few times if you connected the extreme high with subsequent lower highs.
This is just my opinion, but that to me suggests that the trendline is not that significant. You don't necessarily...
This is what worked for me,
-Right-click on the cell and insert Comment
-Right-click on the border of the comment and click "Format Comment"in the menu.
-Choose the Colors and Lines tab, fill section, click the drop-down for Color
-Choose Fill Effects, in Picture , then 'Select Picture'
-Choose your picture and click Insert and click OK
- When you move your mouse over that cell with the comment, it will show your image.When you move out, automatically disappears( just like a comment)
I'm rather picky when it comes to drawing trendlines. I personally wouldn't draw the downward trendline the way you have. I'll try to explain. If you look at the chart there have been numerous lower highs after that extreme high point. If you had followed the market then you would have most likely changed your trendline quite a few times if you connected the extreme high with subsequent lower highs.
This is just my opinion, but that to me suggests that the trendline is not that significant. You don't necessarily...
Ignored
Hey Ace,
In my opinion if you are looking at a 4H-TF and you want to drawn a TL on this chart then it would be recommended to switch to a higher TF in this case this would be the daily. In order to draw a TL "correctly" you'll need a clear view of all the extreme swing highs and lows, in order to have this clear view you'll need to get rid of all the local highs and lows which are considered as "noise", or else you'll end up with a bunch (fan) of TL's which have no significance. What maters is the TL on the higher TF.
I would like to ask for help from people more experienced than me.
i have been trying to look for pa on charts but i realise i have quite a few, how do i be more picky and choose the best? Or should i take all? And about confluence, how do i find confluene? can someone share how they find confluence ad pick the best? Thanks
Hey Ace,
In my opinion if you are looking at a 4H-TF and you want to drawn a TL on this chart then it would be recommended to switch to a higher TF in this case this would be the daily. In order to draw a TL "correctly" you'll need a clear view of all the extreme swing highs and lows, in order to have this clear view you'll need to get rid of all the local highs and lows which are considered as "noise", or else you'll end up with a bunch (fan) of TL's which have no significance. What maters is the TL on the higher TF.
May the force be with...
Ignored
Lemme give me a nice example of drawing these TL. I've attached the daily TF of the E-U in which I have drawn my latest TL's, I've also marked off the extreme swing highs and lows which are the connection points for our up- and down trendlines, it looks like price is sqeezing into a triangle. Now look at the 4H-TF, look how nicely, almost perfectly price respects both TL's. We all know from our price pattern study that price will break out of this triangle below or above. Today price broke out of this triangle with quite some momentum, I was waiting for a pullback but price didn't gave me (yet) a second oppertunity to hop on board. Here the triangle acted as reversal pattern. http://cdn.forexfactory.com/images/icons/icon10.gif
|
Joined Feb 2010
|
Status: J16 Student
|902 Posts
some observations on weekly setups using pins, buo/beob
most of the times you wont get free space on the left side as we get it on daily or h4. on higher tf, the bars look congested. you rarely see a onesided trend for several weeks without a congestion whereas this is common on daily, h4. but the trades do end up successfully inspite of this
the bar structure may not be as perfect as in daily, h4. we may rarely get a perfect pin on weekly compared to daily. however even with little deviations, they work out well. but on daily , h4 if you take a slightly deviated bar (pin, buob,beob) it may result in loss. for weekly setups we can allow slight deviations
on weekly, you cant expect higher returns. RRR of 1:1 is what we get most of the times unless you wait for a very long period and catch the trend. however on daily, h4 you can get better RRR most of the times. thats why i prefer daily, h4. also the wait is less :-)
P.S I don't count pips but the reason I left it in the title was to see how easily people are attracted by the pip count.
Ignored
Hey ace, really enjoyed that video. Really hits home some of the what I already know and use. Love these setups that just work from the onset exactly the way you plan.. I guess the more you practice really the more lucky you get...
|
Joined Feb 2010
|
Status: Make Them Pay
|1,103 Posts
Hi all,
Took my first trade for a couple of weeks yesterday after switching platforms again. Completely had enough of pressure from GFT to trade live in order to keep using their demo so I'm back on MT4 with Alpari until I'm good and ready.
This was a first for me for taking a PA signal off the 1 hour after watching a daily bounce of what i saw was a strong PPZ level.
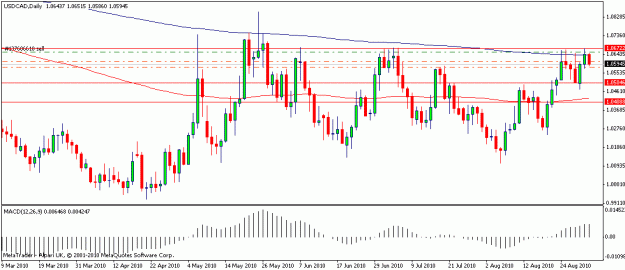
USD/CAD bounced off around 1.067~ area (again) and looked to head south to around 1.0580.
I accidentally fat fingered the sell button instead of setting a sell stop below the low of the the IB at around 1.0650. What I really like about this trade is the R:R - as price had just bounced off the PPZ I set the stop at only around 30 or so pips (10 above the PPZ). I'm so used to setting entries just on the daily charts a 30/35 pip stop felt a bit insane but I think the strength of the PPZ and timing of this one made it OK.
Price is now 10 pips from T/P and I'm locked in at about +47 pips
...., how do i be more picky and choose the best? Or should i take all?
Ignored
should u take all? depends on your personality,trading style, risk profile.
to be more picky, u got to have a list of reasons/trade triggers.
it's like applying for a job. u got to qualify for the list of requirements. u lack 1 or 2 requirements, u dnt get a job. same for trading, if a trade setup lacks 1 or 2 (or more) trade triggers/reasons (according to YOUR rules), then u dnt take that trade.
Quote
Disliked
how do i find confluence? can someone share how they find confluence and pick the best?
confluence definition (just FYI)
by definition, confluence is convergence. in trading, that would mean several trade reasons/factors//triggers in effect, converging or taking effect all at the same time/location.
examples of confluence are Fib retracement, BRN, TL, S/R, PPZ etc. the more confluence factors in effect, the better your chance that the trade will work in your favor.
u have to formulate your own rules (including preferred confluences, etc). u can start with the posts/charts shared here. (learn from a few seniors whom u feel got a similar trading style, personality as yours)
of course, u can continue asking questions
Hope this helps