• Home
  • Forums
  • Trades
  • News
  • Calendar
  • Market
  • Brokers
  • Login
  • Join
  • User/Email: Password:
  • 5:09pm
Menu
  • Forums
  • Trades
  • News
  • Calendar
  • Market
  • Brokers
  • Login
  • Join
  • 5:09pm
Sister Sites
  • Metals Mine
  • Energy EXCH
  • Crypto Craft

Options

Bookmark Thread

First Page First Unread Last Page Last Post

Print Thread

Similar Threads

Trading correlation pairs by using the other pairs 736 replies

Export All pairs or selected pairs to .csv with script 3 replies

Trailing SL EA with hard SLTP for all open trades & all pairs 3 replies

Daily Bar Analysis - All Pairs/All Welcome 15 replies

Trend Trading All Currency Pairs 3 replies

  • Interactive Trading
  • /
  • Reply to Thread
  • Subscribe
  • 4,037
Attachments: Trend Trading All Pairs
Exit Attachments

Trend Trading All Pairs

  • Last Post
  •  
  • 1 390391Page 392393394 656
  • 1 Page 392 656
  •  
  • Post #7,821
  • Quote
  • Aug 26, 2010 8:16am Aug 26, 2010 8:16am
  •  MysticRiver
  • | Joined Jan 2010 | Status: Member | 36 Posts
Quick market update:

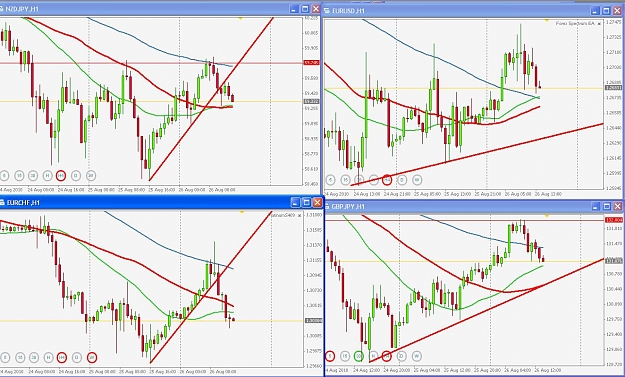
1. NZD/JPY is moving towards point of continuation after reversal, and it is close to point of entry. TP - first at the 80% of swing down. RR is close to 1 - acceptable.

2. EUR/CHF - doesnt formed a good retracement so I'll stay out, moreover the magnitude of move down is too large - risk reverasl parameter in this trade would be lesser than one so it is a second reason to stay out of this trade.

3. EUR/USD is moving down as expectes, so does 4. GBP/JPY.

5. EUR/JPY (not present in this picture) is breaking trendline at this moment, so we are waiting for a BPC setup.
Attached Image (click to enlarge)
Click to Enlarge

Name: H4 market update 2 26 august.JPG
Size: 175 KB
 
 
  • Post #7,822
  • Quote
  • Aug 26, 2010 11:14am Aug 26, 2010 11:14am
  •  Mortician.
  • | Additional Username | Joined Jul 2010 | 225 Posts
Quoting MysticRiver
Disliked
3 SMA doesnt give a clear signal at this moment so I have read and analyzed CB thread.

I looked at todays EUR/USD chart searching for the best candidates (best, high probability zones) for CB entries.

Look at charts below.

1. In the left part we have M1 chart - clear trend up, first swing high, retracement and then BPC.

Right hand of this picture I enlarged first swing and retracement.

Also I added some additional moves not present at this chart - in order to show best zones for CB small entries.

In the second picture I extracted only...
Ignored
I see your point, but here is what i am going to do.

I will first look at daily and h4 S/R areas, i will also check for trendlines areas for any interference.
Then, i will look for a LOB criteria been met.
Then, i will enter at 1 minute candle close after LOB breakout using 10 pips SL.(The 5 seconds is too irrelevant in my opinion. )
Then, i will BE the trade after +5 to +10 pips move in my direction. (BE = Breakeven = OSL)

Since a certain percentage of LOB trades will give a solid BPC before thundering away, i will also enter at the completion of a bpc using 10 pips SL and BE the trade at +5 to +10 pips.

My PT = ADR

I will only trade the LONDON OPEN BREAKOUTS with this approach. Because, in my opinion, LOB gives the strongest moves in the market that is not news-dependent.

That should easily give a 1:10 risk/reward for EUR/USD or EUR/GBP, and 1:25 on other pairs.


ADDENDUM: eur/usd is at S/R level on the daily. I see no reason to touch it.
 
 
  • Post #7,823
  • Quote
  • Aug 26, 2010 11:31am Aug 26, 2010 11:31am
  •  Mortician.
  • | Additional Username | Joined Jul 2010 | 225 Posts
Quoting MktScape
Disliked
Should have been in this move from the red box as a TT ...however missed it ....now thinking of entering on the continuation ...

EDIT: looks like market is changing is mind and forming a bullish hammer after poking into the sell stop.
Ignored
Can i give you a little advice about hector technique, if you dont mind. Beware of the 50% fib level. This is what i mean: On your EUR/JPY CHART If you draw a fib from point A: 107.62 to point B: 105.40. Beware of price retracing or stalling at the 50% fib of point A and Point B = 106.50 If you entry point is too close to that 50%, dont take the trade...when the trade gets to close to that area, take measures.
 
 
  • Post #7,824
  • Quote
  • Aug 26, 2010 11:50am Aug 26, 2010 11:50am
  •  Custos
  • Joined Dec 2006 | Status: Member | 3,852 Posts
Quoting randomperson
Disliked
custos the reason I said there is no edge is because the first 5-sec candle has absolutely no directional edge; in trading things must be proven otherwise. His basis of a system is solely on money management, which is pretty faulty.
Now...5-10-sec entries can be used around s/r spots if very good at volume or price is moving slow. I do this occasionally for very tight stops and giant r:r, but it is based on volume, time, s/r, etc. That is the edge, not the r:r.

Back to vacation
Ignored
yeah, in the beginning I was not aware how he really enters, now that I read more throught it I agree. The system is too "simple" or let's say it doesn't use proper market principles.
 
 
  • Post #7,825
  • Quote
  • Aug 26, 2010 11:58am Aug 26, 2010 11:58am
  •  Custos
  • Joined Dec 2006 | Status: Member | 3,852 Posts
Quoting MysticRiver
Disliked
H4 market update - view in H1 timeframe where the trendlines are present.

1. NZD/JPY - trendline is broken but move down doesnt look as it is finished.

2. EUR/CHF - it looks that we have finisher down move after a trendline break, good reward to risk if levels...
Ignored
good 3 SMA scenarios.

However, I would disagree with one of your statements, in a chart there is nothing like an angle. It totally depends on you scale and since you can stretch out your scale or zoom into the scale the angles become all relative and totally irrelevant. If price moved down dramatically a thousand pips the last few days, then your price scale is totally different than if price just stayed within a 100 pips.
 
 
  • Post #7,826
  • Quote
  • Aug 26, 2010 12:54pm Aug 26, 2010 12:54pm
  •  Mortician.
  • | Additional Username | Joined Jul 2010 | 225 Posts
Quoting Custos
Disliked
good 3 SMA scenarios.

However, I would disagree with one of your statements, in a chart there is nothing like an angle. It totally depends on you scale and since you can stretch out your scale or zoom into the scale the angles become all relative and totally irrelevant. If price moved down dramatically a thousand pips the last few days, then your price scale is totally different than if price just stayed within a 100 pips.
Ignored
Maybe MYSTIC is talking about fib arcs/fans, etc. or one of those Gann's fan or zone thing. Because you can use those to get an "angle" on price action.

Never use them.
 
 
  • Post #7,827
  • Quote
  • Aug 26, 2010 1:17pm Aug 26, 2010 1:17pm
  •  Custos
  • Joined Dec 2006 | Status: Member | 3,852 Posts
hm, okay, I wrote some comments below each of your points here. I personally have a different view concerning your zones.
Well, it's probably the difference of viewing the market. I try to see the market as a whole entity, whereas you zoom in into one aspect of the market without consideration of what the market has done before.

Quoting MysticRiver
Disliked

Zones Z1 and Z2. After Swing high number 1 market didn’t form a new swing high so trend is in fact down – retraces and we don’t know where it stops.
Ignored
do we really not know where it stops? I thought that's what I trade all day long, anticipating where it stops by looking back in the chart.

Quoting MysticRiver
Disliked
Zone Z3.
A minus class move – market broken last swing high (3.), formed new high (5.), retraced to level of support S2 and currently is moving up – we have several bullish signals. (new high, retracement and moving up reflected by support).
Ignored
hm, not really sure how you come up with the grades. For me your Z2 and Z3 are just bounces on different time-frames. Same kind of setups, just one is from the bigger swing, the other from a smaller swing.
Again, historical significance leads the way to see the probabilities. Same goes for Z4 and Z5.

Quoting MysticRiver
Disliked
The next step should be preparation of the method of entry on 5 sec candles and I have several ideas.
Ignored
hm, I think the S/R level should already be spotted on a really low time-frame in order to make the 5 sec work. If you have a level on the h1 or h4 the 5 sec could give way too many wrong signals until price finally shoots off. So I would say a level on the m1 to m5 should be okay.

cheers
 
 
  • Post #7,828
  • Quote
  • Aug 26, 2010 9:41pm Aug 26, 2010 9:41pm
  •  MktScape
  • | Joined Nov 2009 | Status: Member | 780 Posts
http://www.youtube.com/watch?v=djvsj...layer_embedded

http://www.youtube.com/watch?v=tHDT1...eature=related
 
 
  • Post #7,829
  • Quote
  • Aug 26, 2010 10:10pm Aug 26, 2010 10:10pm
  •  MktScape
  • | Joined Nov 2009 | Status: Member | 780 Posts
Quoting Mortician.
Disliked
Can i give you a little advice about hector technique, if you dont mind. Beware of the 50% fib level. This is what i mean: On your EUR/JPY CHART If you draw a fib from point A: 107.62 to point B: 105.40. Beware of price retracing or stalling at the 50% fib of point A and Point B = 106.50 If you entry point is too close to that 50%, dont take the trade...when the trade gets to close to that area, take measures.
Ignored
Hi,
Thanks for the suggestion .... so if i am reading correctly then what you are saying is 'if an entry order is near 50% retrace of the prior impulse then one should be careful in taking that trade'?

An important thing to note is with touch trades entries one may not be present to watch the reaction at 50% ret .....as advance orders are alrady in the market at strong S/R level.

And could you elaborate on 'Take Measures'

thanks
 
 
  • Post #7,830
  • Quote
  • Aug 26, 2010 11:47pm Aug 26, 2010 11:47pm
  •  AndreasF
  • | Joined Apr 2008 | Status: Member | 386 Posts
Hi Custos

I'm getting better in selecting TT for trend- and countertrend trades.
So far I mainly used H1, H4 and D1 for entries.

What is your experience with smaller TF, let's say the M5.
Would you recommend doing TT also on smaller TF?

Please advice
Andreas
 
 
  • Post #7,831
  • Quote
  • Aug 27, 2010 12:09am Aug 27, 2010 12:09am
  •  Custos
  • Joined Dec 2006 | Status: Member | 3,852 Posts
Quoting AndreasF
Disliked
Hi Custos

I'm getting better in selecting TT for trend- and countertrend trades.
So far I mainly used H1, H4 and D1 for entries.

What is your experience with smaller TF, let's say the M5.
Would you recommend doing TT also on smaller TF?

Please advice
Andreas
Ignored
hm, low time-frames are a difficult topic. They do work but with less likelihood since the market can just blow through them. It really depends if you have strong higher time-frame levels nearby and the time of the day and if there are news coming out and other possible factors I didn't think of yet.

However, I think lower timeframes can be traded as well, just need to be more careful which levels we trade there.
 
 
  • Post #7,832
  • Quote
  • Aug 27, 2010 12:20am Aug 27, 2010 12:20am
  •  AndreasF
  • | Joined Apr 2008 | Status: Member | 386 Posts
Thanks, Custos

I will test M5 and M15 on all majors for 30 days -trading time for this will be after NY lunch only -and will share the results here end of September.

Maybe we can develop a little scalp method out of it?


Quoting Custos
Disliked
hm, low time-frames are a difficult topic. They do work but with less likelihood since the market can just blow through them. It really depends if you have strong higher time-frame levels nearby and the time of the day and if there are news coming out and other possible factors I didn't think of yet.

However, I think lower timeframes can be traded as well, just need to be more careful which levels we trade there.
Ignored
 
 
  • Post #7,833
  • Quote
  • Aug 27, 2010 12:35am Aug 27, 2010 12:35am
  •  Custos
  • Joined Dec 2006 | Status: Member | 3,852 Posts
Quoting AndreasF
Disliked
Thanks, Custos

I will test M5 and M15 on all majors for 30 days -trading time for this will be after NY lunch only -and will share the results here end of September.

Maybe we can develop a little scalp method out of it?
Ignored
yeah, good experiment. I like doing such experiments on all kinds of topics all the time.

By the way, attached is a very recent eur/usd m1 level that worked out beautifully, so you see, these levels also work even on the m1.

Well, but for the newbies, don't start trading the low time-frames, you gonna blow your account. Better to stick with the higher time-frames in the beginning until you can pick the levels.

cheers
Attached Image (click to enlarge)
Click to Enlarge

Name: 27.8.2010 eurusd m1.gif
Size: 25 KB
 
 
  • Post #7,834
  • Quote
  • Aug 27, 2010 6:55am Aug 27, 2010 6:55am
  •  randomperson
  • | Joined Jul 2009 | Status: Member | 104 Posts
Quoting AndreasF
Disliked
Hi Custos

I'm getting better in selecting TT for trend- and countertrend trades.
So far I mainly used H1, H4 and D1 for entries.

What is your experience with smaller TF, let's say the M5.
Would you recommend doing TT also on smaller TF?

Please advice
Andreas
Ignored
When you keep hearing 'higher timeframes are better' etc etc it is due to price range. On lower timeframes, levels tend to work almost as good but there is a catch: 1 tick may be 25-75% of the move to the next pivot. As you cannot breakdown 1 tick, it becomes extremely hard to trade lower timeframe levels. There is also lower dependability in the s/r as you aren't piggybacking where a giant amount of orders are, as not many big orders will be able to be spread on one pivot on low timeframes. People who claim all timeframes are the same are wrong.
 
 
  • Post #7,835
  • Quote
  • Aug 27, 2010 8:16am Aug 27, 2010 8:16am
  •  AndreasF
  • | Joined Apr 2008 | Status: Member | 386 Posts
Thanks for your reply, Randomperson

If trading exclusively touch trades, what would you think being more profitable at the months end: less trades on higher timeframes with higher RR or many scalps on e.g. M5 with lower RR?


Quoting randomperson
Disliked
When you keep hearing 'higher timeframes are better' etc etc it is due to price range. On lower timeframes, levels tend to work almost as good but there is a catch: 1 tick may be 25-75% of the move to the next pivot. As you cannot breakdown 1 tick, it becomes extremely hard to trade lower timeframe levels. There is also lower dependability in the s/r as you aren't piggybacking where a giant amount of orders are, as not many big orders will be able to be spread on one pivot on low timeframes. People who claim all timeframes are the same are wrong....
Ignored
 
 
  • Post #7,836
  • Quote
  • Aug 27, 2010 9:12am Aug 27, 2010 9:12am
  •  Custos
  • Joined Dec 2006 | Status: Member | 3,852 Posts
Quoting AndreasF
Disliked
Thanks for your reply, Randomperson

If trading exclusively touch trades, what would you think being more profitable at the months end: less trades on higher timeframes with higher RR or many scalps on e.g. M5 with lower RR?
Ignored
R:R is time-frame independent.

risking 10 to get 100 pips on h1 is the same as risking 1 to get 10 pips on m5, same R:R (this is of course hypothetical)

Only you yourself can know what will be more profitable. I don't know how you trade and you don't know how I trade, we won't take the same setups.

cheers
 
 
  • Post #7,837
  • Quote
  • Aug 27, 2010 9:37am Aug 27, 2010 9:37am
  •  MktScape
  • | Joined Nov 2009 | Status: Member | 780 Posts
This month's price action has been very slow IMO .... I think its th August effect when the large trades go on vacations.

What you guys think.
 
 
  • Post #7,838
  • Quote
  • Aug 27, 2010 9:42am Aug 27, 2010 9:42am
  •  Custos
  • Joined Dec 2006 | Status: Member | 3,852 Posts
Quoting MktScape
Disliked
This month's price action has been very slow IMO .... I think its th August effect when the large trades go on vacations.

What you guys think.
Ignored
yeah, price is ranging a lot, going up and down. not sure if it's slow intraday, I think the average daily range is still the same. Just there is not really a follow through on most pairs
 
 
  • Post #7,839
  • Quote
  • Aug 27, 2010 9:43am Aug 27, 2010 9:43am
  •  randomperson
  • | Joined Jul 2009 | Status: Member | 104 Posts
Quoting MktScape
Disliked
This month's price action has been very slow IMO .... I think its th August effect when the large trades go on vacations.

What you guys think.
Ignored
yup, expected in august. this week is range-based on all the pairs i focus on. index's have been slow as heck most of the month as well.
 
 
  • Post #7,840
  • Quote
  • Aug 27, 2010 11:40am Aug 27, 2010 11:40am
  •  AndreasF
  • | Joined Apr 2008 | Status: Member | 386 Posts
I took AU on H4 short a couple of minutes ago.
Touch trade at supply zone.

Should be the last trade this week
It is a pleasure learning from you, guys.

Have a nice weekend you all.
Attached Image (click to enlarge)
Click to Enlarge

Name: au.gif
Size: 13 KB
 
 
  • Interactive Trading
  • /
  • Trend Trading All Pairs
  • Reply to Thread
    • 1 390391Page 392393394 656
    • 1 Page 392 656
0 traders viewing now
  • More
Top of Page
Forex Factory Blog Updated: Alerting All Members
  • Facebook
  • Twitter
About FF
  • Mission
  • Products
  • User Guide
  • Media Kit
  • Blog
  • Contact
FF Products
  • Forums
  • Trades
  • Calendar
  • News
  • Market
  • Brokers
  • Trade Explorer
FF Website
  • Homepage
  • Search
  • Members
  • Report a Bug
Follow FF
  • Facebook
  • Twitter

FF Sister Sites:

  • Metals Mine
  • Energy EXCH
  • Crypto Craft

Forex Factory® is a brand of Fair Economy, Inc.

Terms of Service / ©2022