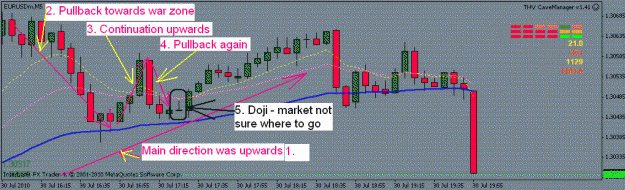
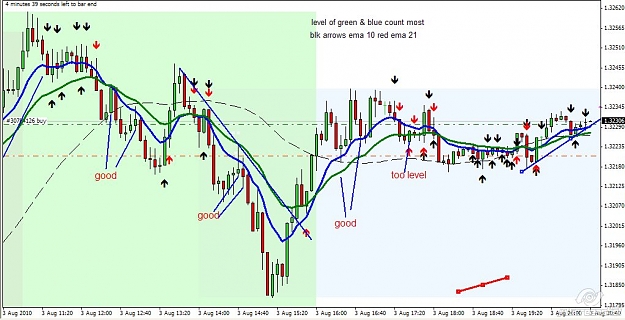
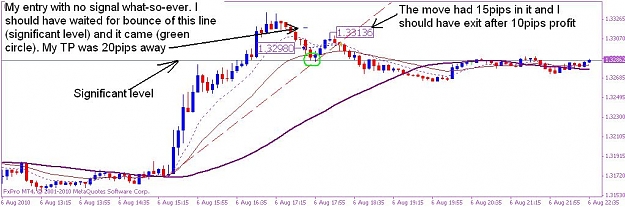
DislikedYes, it was one of those setups that was calling you.
Your dark blue line (significant level) said it all.Ignored
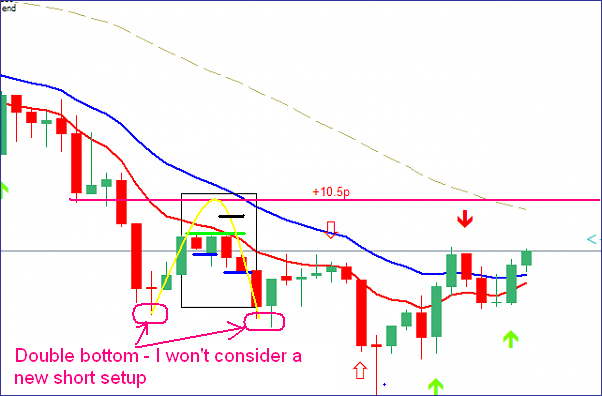
Could you just explain something to me about the Doji set up please?....
To my understanding a Doji is a bar of the market not being sure which way to go next or indecision....so going on what you say taking the break of the Doji on this trade.. would that mean that a Doji should always be treated as to take a trade off the break of the direction it breaks out in from the Doji on the following bar?
cheers for any help on this Willem..
Adrian