DislikedThanks todder . I use PF & price action @ ML & Support & Resistance zone.
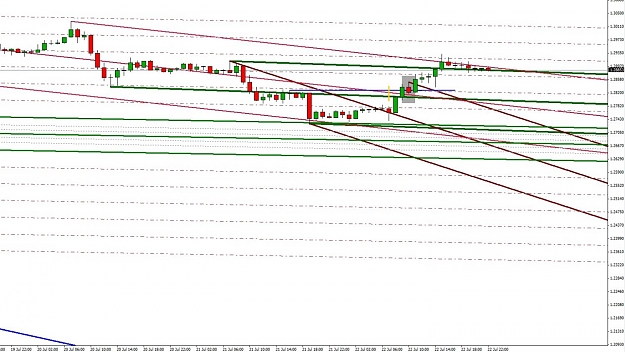
I covered my GJ & Holding EJ shorts. Now reenter GJ @ 133.577 with small position . Let us see how it will unfold.
Regards,
TAQIgnored
Happy trading you all
TAQ
Attached Image(s) (click to enlarge)