• Home
  • Forums
  • Trades
  • News
  • Calendar
  • Market
  • Brokers
  • Login
  • Join
  • 12:59am
Menu
  • Forums
  • Trades
  • News
  • Calendar
  • Market
  • Brokers
  • Login
  • Join
  • 12:59am
Sister Sites
  • Metals Mine
  • Energy EXCH
  • Crypto Craft

Options

Bookmark Thread

First Page First Unread Last Page Last Post

Print Thread

Similar Threads

Simple Reversal Spotting Trades (MA/Elliott Wave Osc) 1 reply

Trend identification and trend change spotting 8 replies

Spotting patterns with camera 9 replies

Need Help Spotting Coding Error 6 replies

Trend spotting 42 replies

  • Trading Discussion
  • /
  • Reply to Thread
  • Subscribe
  • 38
Attachments: Trend-spotting
Exit Attachments
Tags: Trend-spotting
Cancel

Trend-spotting

  • Last Post
  •  
  • 1 345Page 67 8
  • 1 5Page 67 8
  •  
  • Post #101
  • Quote
  • Jul 17, 2010 9:29am Jul 17, 2010 9:29am
  •  amirul
  • | Joined Jul 2010 | Status: Junior Member | 2 Posts
Quoting D3trax
Disliked
i hope that this version should be final, this one should recount itself without refresh (v4 had an issue with recounting ...)
Ignored
thank you very much for sharing it!!
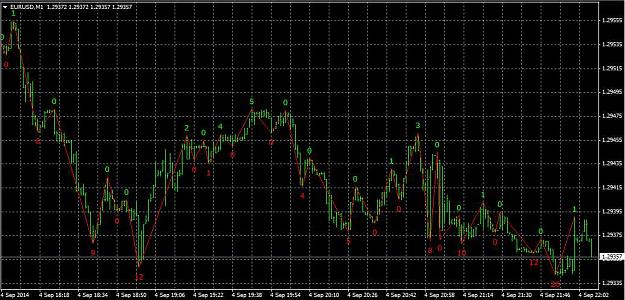
i would like to ask how do we know that the trend is ending??can we just assume that the uptrend or downtrend number is from range 1 < trend no < 10 for a periiod of time n wait for the next up or downmove breakout to enter the trade??
 
 
  • Post #102
  • Quote
  • Jul 17, 2010 9:40am Jul 17, 2010 9:40am
  •  amirul
  • | Joined Jul 2010 | Status: Junior Member | 2 Posts
Quoting eagle4x
Disliked
Here's a method I came up with to filter the bar values using a modified laguerre indicator:

1) Enter long when long bar value > 10 and if laguerre increasing and crossed above either .15, .50, or .85. Exit position if laguerre crosses below either .85, .50, or .15.

2) Enter short when short bar value > 10 and if laguerre decreasing and crossed below either .85, .50, or .15. Exit position if laguerre crosses above either .15, .50, or .85.

Long or short values can be any # you want to use, I just chose 10.

Attached is chart and indicator,...
Ignored
hi there. thanks for the great post n indicator.
i would like to ask if before a strong uptrend does the laguerre indi touches 0.85 and go down to 0.5 before going for the breakout??or there are other ways we can know from this indicator that there will be a breakout?? price channel maybe.
Attached Image
 
 
  • Post #103
  • Quote
  • Jul 17, 2010 10:53pm Jul 17, 2010 10:53pm
  •  eagle4x
  • | Joined Sep 2005 | Status: pip my ride | 507 Posts
It doesn't happen every time, as no indicator is fool proof - just have observe it on chart and see most occurences.

Quoting amirul
Disliked
hi there. thanks for the great post n indicator.
i would like to ask if before a strong uptrend does the laguerre indi touches 0.85 and go down to 0.5 before going for the breakout??or there are other ways we can know from this indicator that there will be a breakout?? price channel maybe.
Ignored
 
 
  • Post #104
  • Quote
  • Jul 19, 2010 3:51am Jul 19, 2010 3:51am
  •  gary summers
  • | Additional Username | Joined Jul 2010 | 5 Posts
hi:
Just wanted to mention the quote is incorrect:

Money is not the root of all evil - it is - the LOVE of money is the root of all evil.

Money is helpful to us in many ways. But the love for money becomes greed and then all else fails.
 
 
  • Post #105
  • Quote
  • Jul 19, 2010 5:23am Jul 19, 2010 5:23am
  •  sharpster
  • | Commercial Member | Joined Mar 2010 | 69 Posts
Bytebodger,

Just bought an ebook entitled "riding the trend", pretty good stuff and i think you`ll find it usefull in this thread, once i`m through with it i`ll post it here.


Regards

Sharpster
 
 
  • Post #106
  • Quote
  • Jan 14, 2011 1:25pm Jan 14, 2011 1:25pm
  •  hanover
  • Joined Sep 2006 | Status: ... | 8,092 Posts
This thread is worthy of a bump, IMO. Bytebodger's concept is very unique and valid way of defining trend direction and strength, and his numbering system reflects breakouts through previous candle highs/lows (implied S/R). There's less calibration (and hence scope for curve-fitting) involved than with other trend measuring indys like MAs or ATR-based swing indys.

Attached is an indy that counts the candles automatically, and also plots arrows when the trend changes, according to the rules outlined by Bytebodger in the early posts of the thread. Assuming that I understand correctly:

1. The count value assigned to an up-candle (close>open) is the number of candles since its high was exceeded by a prior candle's high. The count value assigned to an down-candle (close<open) is the number of candles since its low was overrun by a prior candle's low.

2. The trend turns bullish from the time a non-zero up-candle value exceeds the most recent non-zero down-candle value, and turns bearish when a non-zero down-candle value exceeds the most recent non-zero up-candle value.

For candles whose count is zero, the '0' is not displayed, since these candles are effectively ignored by Bytebodger's formula.


  1. To turn the numbers off, set TextFontSize to 0
  2. To turn the arrows off, set ArrowSize to 0
  3. The UpArrow and DnArrow parameters are the numerical code of the Wingdings characters used to plot the arrows
  4. To have the numbers/arrows plot further away from the candle highs/lows, increase VertSpacing, and vice versa.

Hopefully the other parameters are self-explanatory.

Experiment and enjoy. Happy trend hunting,
David

Attached File(s)
File Type: mq4 Trend Count.mq4   80 KB | 1,033 downloads
 
 
  • Post #107
  • Quote
  • Jan 18, 2011 4:43am Jan 18, 2011 4:43am
  •  forexsaint
  • Joined Jun 2009 | Status: &lt;-That's how u gonna b, in the END! | 1,509 Posts
I did try to incorporate this in my normal LIVE trading to higher TF's (some 2 months back) and it was helpful to SOME extent for sure.
But later it kinda got off my regular trading tool shelf (It will be back on)

And
I second the above hanover's post and thoughts.
Its a very VALID and quite un-biased concept with quite a few confounding factors and rule jargon

As usual, i appreciate hanover's service to the community and help on this thread.
Pretty handy tool
(Don't know who were those 32 indi downloaders till now, in above post, who didn't even care to say thanks.)

Regards
100 Fold Challenge->Interested? ->https://www.forexfactory.com/thread/32152
 
 
  • Post #108
  • Quote
  • Jan 21, 2011 4:24am Jan 21, 2011 4:24am
  •  Jolly Jumper
  • | Joined Mar 2010 | Status: Member | 32 Posts
I find it a very interesting indicator. But the rules don't make any sense to me though.

Example:
Trend is UP (long). The number says 50 points.
Now price goes down. It can go down 50 bars until the rules say the trend has turned. Unless there is at least one bar that goes higher than the previous bar. So it will say the number 1. Which is a lot easier to overtake.

So in order to say the trend is now down (short) price needs to go up. If not price can go 50 hours, days, weeks in one direction and still be in the opposite trend.

To me it would make more sense to just pick a number, like 20 with a previous bar of at least 10, to determine a trend.
 
 
  • Post #109
  • Quote
  • Nov 2, 2012 12:40pm Nov 2, 2012 12:40pm
  •  Ishtana
  • | Commercial Member | Joined Aug 2012 | 313 Posts
I like this original idea. It does make sense. But I think it is still way underdeveloped. I think we could also mathematically count the movement within the bar. Say a variable will keep track every uptick that happens in one bar and another variable will keep track every downtick that happens is the bar. Both can be further enhanced by including the size of pips for every up and down tick.

When the candle closes, it should display the difference, coupled with the trend count number. If it is negative, it is an indication of a down trend. If it is positive, it is an indication of a up trend. The larger the number the stronger the likelihood of the continuing trend. Isn't this the idea behind price action indicator?

What do you say Bytebodger?
 
 
  • Post #110
  • Quote
  • Aug 21, 2014 7:58pm Aug 21, 2014 7:58pm
  •  szpowerx
  • | Joined May 2011 | Status: Member | 462 Posts
mark
Outcome is not important at all, but correct technique is what only matters
 
 
  • Post #111
  • Quote
  • Aug 22, 2014 2:56am Aug 22, 2014 2:56am
  •  antonsatu
  • | Joined Aug 2009 | Status: Member | 431 Posts
It sounds good. But not applicable.
 
 
  • Post #112
  • Quote
  • Aug 25, 2014 12:57pm Aug 25, 2014 12:57pm
  •  Sciurus
  • Joined Oct 2012 | Status: Goodbye | 247 Posts
A very interesting concept.
I stumbled upon a somewhat similar idea after creating an indicator this thread http://www.forexfactory.com/showthre...07#post7685007

Since then I've been exploring n-back bars as a breakout strategy i.e. when price breaks n-bars back, what is the probability of a reversal or continuation, keeping in mind the success/failure of the last n-bar breakout and whether it was a bull or bear breakout.

Subscribed.
 
 
  • Post #113
  • Quote
  • Aug 25, 2014 1:13pm Aug 25, 2014 1:13pm
  •  Sciurus
  • Joined Oct 2012 | Status: Goodbye | 247 Posts
So for example, if trend on the daily is down, then on the 5 minute chars - fade bull n-bar breaks, and breakout trade the bear n-bar breaks.

Just an idea that I am exploring.
 
 
  • Post #114
  • Quote
  • Aug 29, 2014 10:44am Aug 29, 2014 10:44am
  •  LucaJabs
  • | Joined Aug 2014 | Status: Member | 10 Posts
Trend spotting is no easy business while trading. Matching trends to current market conditions is a bigger business. Sometimes I use the Aroon Indicator. This helps me locate spot potential reversals and trends. It works with the Aroon up (which is red) and Aroon down (which is green) lines. These two lines lines operate in a specific range between 0-100, assisting in unveiling currency pair’s strength or weakness.
 
 
  • Post #115
  • Quote
  • Sep 3, 2014 5:26pm Sep 3, 2014 5:26pm
  •  LITEchild
  • Joined Nov 2013 | Status: Member of the 5% club | 1,256 Posts
Quoting hanover
Disliked
This thread is worthy of a bump, IMO. Bytebodger's concept is very unique and valid way of defining trend direction and strength, and his numbering system reflects breakouts through previous candle highs/lows (implied S/R). There's less calibration (and hence scope for curve-fitting) involved than with other trend measuring indys like MAs or ATR-based swing indys. Attached is an indy that counts the candles automatically, and also plots arrows when the trend changes, according to the rules outlined by Bytebodger in the early posts of the thread....
Ignored
Hello Hanover. Is it possible to make this indicator work with the Latest build 670 of MT4? Tnx.
Understanding liquidity, Time Action and Price Action is priceless!
 
 
  • Post #116
  • Quote
  • Sep 3, 2014 6:23pm Sep 3, 2014 6:23pm
  •  kprsa
  • Joined Feb 2014 | Status: ember | 1,268 Posts
Quoting LITEchild
Disliked
{quote} Hello Hanover. Is it possible to make this indicator work with the Latest build 670 of MT4? Tnx.
Ignored
Quick and dirty...
Cheers,
kprsa
Attached File(s)
File Type: mq4 Trend Count 670.mq4   5 KB | 548 downloads
 
 
  • Post #117
  • Quote
  • Sep 3, 2014 6:54pm Sep 3, 2014 6:54pm
  •  LITEchild
  • Joined Nov 2013 | Status: Member of the 5% club | 1,256 Posts
Quoting kprsa
Disliked
{quote} Quick and dirty... Cheers, kprsa {file}
Ignored
oh! Tnx so much buddy! Nice! PM!
Understanding liquidity, Time Action and Price Action is priceless!
 
 
  • Post #118
  • Quote
  • Sep 4, 2014 12:05pm Sep 4, 2014 12:05pm
  •  Madmoney
  • Joined Jul 2012 | Status: KILL ZONE TEKKERS | 596 Posts
This a good concept, I was wondering why stop there.

Could this concept by applied to individual zz legs???

MM
 
 
  • Post #119
  • Quote
  • Sep 4, 2014 12:10pm Sep 4, 2014 12:10pm
  •  vlady1974
  • Joined Jul 2009 | Status: Left Leg In, Right Leg Out! | 5,792 Posts
Quoting Madmoney
Disliked
This a good concept, I was wondering why stop there. Could this concept by applied to individual zz legs??? MM
Ignored
A pip is only worth it if you know how much you risked to earn it
 
 
  • Post #120
  • Quote
  • Edited Sep 5, 2014 4:16am Sep 4, 2014 6:11pm | Edited Sep 5, 2014 4:16am
  •  kprsa
  • Joined Feb 2014 | Status: ember | 1,268 Posts
Quoting Madmoney
Disliked
This a good concept, I was wondering why stop there. Could this concept by applied to individual zz legs??? MM
Ignored
EDIT: The most recent version (with additional options) is given in this post:
http://www.forexfactory.com/showthre...65#post7719165


Hi, please see the attached indicator.
Let me know if there are bugs...

Cheers,
kprsa

Attached File(s)
File Type: mq4 ZigZagCount.mq4   11 KB | 334 downloads


Attached Image (click to enlarge)
Click to Enlarge

Name: Clipboard01.jpg
Size: 74 KB
 
 
  • Trading Discussion
  • /
  • Trend-spotting
  • Reply to Thread
    • 1 345Page 67 8
    • 1 5Page 67 8
0 traders viewing now
  • More
Top of Page
  • Facebook
  • Twitter
About FF
  • Mission
  • Products
  • User Guide
  • Media Kit
  • Blog
  • Contact
FF Products
  • Forums
  • Trades
  • Calendar
  • News
  • Market
  • Brokers
  • Trade Explorer
FF Website
  • Homepage
  • Search
  • Members
  • Report a Bug
Follow FF
  • Facebook
  • Twitter

FF Sister Sites:

  • Metals Mine
  • Energy EXCH
  • Crypto Craft

Forex Factory® is a brand of Fair Economy, Inc.

Terms of Service / ©2023