• Home
  • Forums
  • Trades
  • News
  • Calendar
  • Market
  • Brokers
  • Login
  • Join
  • User/Email: Password:
  • 10:53pm
Menu
  • Forums
  • Trades
  • News
  • Calendar
  • Market
  • Brokers
  • Login
  • Join
  • 10:53pm
Sister Sites
  • Metals Mine
  • Energy EXCH
  • Crypto Craft

Options

Bookmark Thread

First Page First Unread Last Page Last Post

Print Thread

Similar Threads

Simple Reversal Spotting Trades (MA/Elliott Wave Osc) 1 reply

Trend identification and trend change spotting 8 replies

Spotting patterns with camera 9 replies

Need Help Spotting Coding Error 6 replies

Trend spotting 42 replies

  • Trading Discussion
  • /
  • Reply to Thread
  • Subscribe
  • 38
Attachments: Trend-spotting
Exit Attachments
Tags: Trend-spotting
Cancel

Trend-spotting

  • Last Post
  •  
  • Page 1 23456 8
  • Page 1 234 8
  •  
  • Post #1
  • Quote
  • First Post: Mar 25, 2010 1:23pm Mar 25, 2010 1:23pm
  •  Bytebodger
  • | Joined Apr 2007 | Status: Burning pips since 2007... | 340 Posts
In this thread I'm going to outline a method for quantifying a currency pair's current trend. Understanding the current trend is one of the most fundamental aspects of trading, and yet I have found that this seemingly simple task can be devilishly deceptive.

People love to spew aphorisms like "The trend is your friend" but they seem to assume that "the trend" is painfully obvious. But when you ask around you usually receive many subjective answers. Which trend are we talking about? The long-term trend? Mid-term? Short-term? And what defines long/mid/short term anyway? If I'm looking at a daily chart, which most would say encompasses much of the "long-term" trend, how many bars comprise the "current" trend? The last 10 bars? The last 30? The last 365? My point here is that simply defining the current trend encompasses a lot of room for argument, even amongst seasoned traders.

I've recently come up with a method to quantify trends that suits my style. I came up with the method on my own, but I'm not claiming it's new. Maybe it's been out there for many years - I don't know. I just know that I haven't personally seen it spelled out in the manner that I'm about to spell it out.
  • Post #2
  • Quote
  • Mar 25, 2010 1:35pm Mar 25, 2010 1:35pm
  •  Bytebodger
  • | Joined Apr 2007 | Status: Burning pips since 2007... | 340 Posts
The first key for me in quantifying a trend is to apply some sort of mathematical process to the effort. I hate - absolutely loathe - the idiotic responses that some others post in similar threads that go something like this:

"If the price is lower at the right end of the chart than it is at the left end, then the trend is down. If the price is higher at the right end of the chart than it is at the left end, then the trend is up."

Oh really? So in other words, your entire definition of "trend" relies upon how many bars/candlesticks you've managed to squeeze into your chart. If you zoom entirely out, the trend may look strongly downward but if you zoom entirely in, the trend for the exact same pair may look strongly upward.

So my first key is to be able to quantify the trend. If I can't attach some sort of number to it, then I'm not interested in it. Besides, most charts are not so clean-and-easy to read as a pure diagonal line going downward or upward across your chart. Usually there are bumps and reversals that can complicate one's desire to do a quick visual check.

I'm not saying that the math has to be complicated. In fact, the method I'm going to outline really encompasses nothing more than counting. But this is still more quantitative than simply eyeballing a chart.

In case your wondering, I do realize there are plenty of indicators that will quantify trend. The most obvious of these is the MA. I'm not saying that there's anything wrong with using a MA (although it still leads to the argument of which time period to use on your MA or which calculation method (simple, exponential, etc.) to use. I personally feel that my method is more effective than a MA, but others will undoubtedly disagree.
 
 
  • Post #3
  • Quote
  • Mar 25, 2010 1:51pm Mar 25, 2010 1:51pm
  •  sharpster
  • | Commercial Member | Joined Mar 2010 | 69 Posts
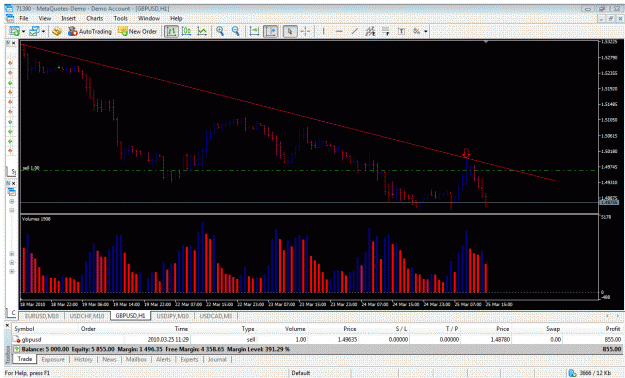
Once you recognise strength and weakness following the trend is pretty simple, took this trade today....

weakness in the background, tried to rally, entered trade on a weak up bar closing in the middle on high volume indicating sellers .
Attached Image (click to enlarge)
Click to Enlarge

Name: GBPUSDH1.gif
Size: 56 KB
 
 
  • Post #4
  • Quote
  • Mar 25, 2010 2:33pm Mar 25, 2010 2:33pm
  •  Bytebodger
  • | Joined Apr 2007 | Status: Burning pips since 2007... | 340 Posts
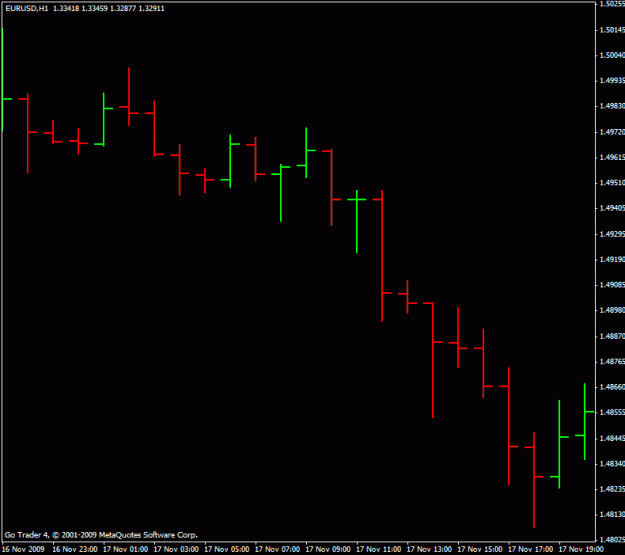
So let's start with an illustration. I'm attaching a basic bar chart for EURUSD. I like to ensure that the up bars are green and the down bars are red so it makes it very easy to sort them out when I'm counting.

So what is the trend on this chart? On one hand, there is a clear downward push up until the last 2 bars. It's very easy just to say that the trend is downward, but I want to quantify it. I'll show how I do that in the next post.

(If you're thinking that this chart is painfully obvious, I will be the first to admit that it is clearly in a down trend, even by using just the naked eye. But the key question I'm trying to quantify with trend is, "At what point - if at all - does that up tick at the end of the sequence become a true reversal? Rather than just a blip on the downward march?")
Attached Image (click to enlarge)
Click to Enlarge

Name: eurusd_001.gif
Size: 12 KB
 
 
  • Post #5
  • Quote
  • Edited Mar 26, 2010 7:33am Mar 25, 2010 3:01pm | Edited Mar 26, 2010 7:33am
  •  Bytebodger
  • | Joined Apr 2007 | Status: Burning pips since 2007... | 340 Posts
Here is the same chart with some handy-dandy numbers written on it. The numbering system is extremely simple. After the completion of each bar, you assign it a number. The number is counted like this:


  1. If the bar closed UP, then you look at the HIGH of that bar and you count how many bars it has been since any other bar has been that high.
  2. If the bar closed DOWN, then you look at the LOW of that bar and you count how many bars it has been since any other bar has been that low.


When you are trying to quantify the direction and strength of a trend, you count the most recent UP trend and compare it to the most recent DOWN trend. So you can see that in this example, the up trend is still very weak , even after two up bars. However, the down trend is still very strong. The last down bar had a low that had not been matched in the last 48 bars. So at this point, there is no reason to quantify this as anything other than a downward trend.

There is only one more catch to this counting method. If the last up bar has a value of "0", then use the value of the up bar prior to that one. If the last down bar has a value of "0", then use the value of the down bar prior to that one. If the last TWO up/down bars have values of "0", then the "strength" of that trend direction is 0.

Attached Image (click to enlarge)
Click to Enlarge

Name: eurusd_002.gif
Size: 13 KB
 
 
  • Post #6
  • Quote
  • Edited Mar 26, 2010 7:35am Mar 25, 2010 3:19pm | Edited Mar 26, 2010 7:35am
  •  Bytebodger
  • | Joined Apr 2007 | Status: Burning pips since 2007... | 340 Posts
I'm not posting this trend-counting method as a trading system, but if you wanted to trade off these trends, what kind of signals might there be?

This chart is the same as the last, except that there are two down arrows marked where one might consider taking a short position. I am assuming that you would enter the trade at the very BEGINNING (or opening) of the marked bars.

The first downward arrow comes after a down bar with a strength of 4. Before that down bar, the most recent up bar had a strength of 3. So the downward trend is leading the upward trend by a strength of 1 bar.

The second downward arrow comes after a down bar with a strength of 14. Before that down bar, the most recent up bar had a strength of 5. So the downward trend is leading the upward trend by a strength of 9 bars.

Given this bit of simple math, it's also logical that it took the first trade longer to materialize than the second, since the first trade was made with only a net downward trend of 1 bar and the second was made with a net downward trend of 9 bars.
Attached Image (click to enlarge)
Click to Enlarge

Name: eurusd_003.gif
Size: 14 KB
 
 
  • Post #7
  • Quote
  • Edited Mar 26, 2010 7:36am Mar 25, 2010 3:41pm | Edited Mar 26, 2010 7:36am
  •  Bytebodger
  • | Joined Apr 2007 | Status: Burning pips since 2007... | 340 Posts
If the trend is going to reverse, how/when do we quantify that event as having happened? The attached chart shows this process.

In the previous post, I said that those two up bars after the deep dip did not qualify as a reversal because their up trends are only scored as 1 and 2 respectively. But the most recent down trend was scored quite highly - 48 - and thus it would be no time to begin going long on the pair.

But when we fast-forward 5 bars, we see a slow, continuing upswing in the up bars and only a couple of weak down bars. Finally, when the last bar in the chart opens, the most recent down trend is a 1 and the most recent up trend is a 6. This indicates that the trend might be rising.

If you're wondering why a trend reversal isn't triggered several bars earlier after the "4" up bar, it's because, at that point, the most recent down bar was scored a 0. And when the most recent bar in either direction is scored as a 0, you must go to the previous bar to discern the current upward/downward trend. In this case, we saw an upward bar with a score of 4 and a downward bar with a score of 0, but if we went to the previous downward bar, it had a score of 48, meaning that we were still respecting the downward trend.
Attached Image (click to enlarge)
Click to Enlarge

Name: eurusd_004.gif
Size: 14 KB
 
 
  • Post #8
  • Quote
  • Mar 25, 2010 3:55pm Mar 25, 2010 3:55pm
  •  Bytebodger
  • | Joined Apr 2007 | Status: Burning pips since 2007... | 340 Posts
So zooming out, we see how the scoring of each bar according to its low (if it closed down) or its high (if it closed up) in relation to previous lows/highs dynamically dictates the strength of the trend as it first dips downward and then climbs back upward.
Attached Image (click to enlarge)
Click to Enlarge

Name: eurusd_005.gif
Size: 15 KB
 
 
  • Post #9
  • Quote
  • Mar 25, 2010 4:09pm Mar 25, 2010 4:09pm
  •  Bytebodger
  • | Joined Apr 2007 | Status: Burning pips since 2007... | 340 Posts
Another reason I like this method of trend-spotting is that it seems to be less prone to the dreaded whipsaw. Don't get me wrong, you will still find false reversals - any trend following process will - but I have also found numerous times when a strong retracement does NOT trigger a trend reversal using my bar-counting method. Let's look at an example from just yesterday on USDJPY.

Clearly there was a very strong run-up in USDJPY, but what I'm going to focus on is the big retracement highlighted between the red lines.
Attached Image (click to enlarge)
Click to Enlarge

Name: usdjpy_001.gif
Size: 14 KB
 
 
  • Post #10
  • Quote
  • Mar 25, 2010 4:37pm Mar 25, 2010 4:37pm
  •  Bytebodger
  • | Joined Apr 2007 | Status: Burning pips since 2007... | 340 Posts
Here's the same chart zoomed in with my counts added to each bar. Clearly, USDJPY is in a huge upswing - it doesn't take a magician to figure that out. But what about the retracement between the red lines? Will that develop into a serious reversal? The counting method says "No" because the largest downward trend never comes close to eclipsing the largest upward trend (I just listed it on the chart as "99+" because I didn't want to go back who-knows-how-many pages and count all those bars).

The key is that all those "99+" upward bars act as guardians keeping the upward trend quantified and keeping the counting system from misidentifying the retracement as a trend reversal.
Attached Image (click to enlarge)
Click to Enlarge

Name: usdjpy_002.gif
Size: 16 KB
 
 
  • Post #11
  • Quote
  • Mar 25, 2010 4:42pm Mar 25, 2010 4:42pm
  •  Bytebodger
  • | Joined Apr 2007 | Status: Burning pips since 2007... | 340 Posts
Quoting gangsta1
Disliked
THis is a comlicated thread for spotting a trend. Since I took a break from manual trading and come back I see the chrts in a different way. Before I would over analyse everything with dodgy indicators. Now I can just look at a chart and say "thats going up" , "thats trending down", "thats doing nothing!"
Ignored
Sigh...
 
 
  • Post #12
  • Quote
  • Mar 25, 2010 6:18pm Mar 25, 2010 6:18pm
  •  Bytebodger
  • | Joined Apr 2007 | Status: Burning pips since 2007... | 340 Posts
Quoting sharpster
Disliked
Once you recognise strength and weakness following the trend is pretty simple, took this trade today....

weakness in the background, tried to rally, entered trade on a weak up bar closing in the middle on high volume indicating sellers .
Ignored
This dovetails nicely with my bar-counting methodology because, under my system, that little upturn would have been totally quantified as still a part of the downward trend. If I were trading it, I have to admit that I wouldn't have shorted it quite as early as you did - I would have waited for that first downward bar to confirm that it was returning to the longer-term trend.

Nice work.
 
 
  • Post #13
  • Quote
  • Mar 25, 2010 10:59pm Mar 25, 2010 10:59pm
  •  FXEZ
  • Joined Jan 2007 | Status: developing... | 970 Posts
Thank you for posting this thought provoking original idea. It's rare indeed to see original research on this forum and on a subject that I'm also investigating. Very nice presentation, original content and easy to understand objective rules of identification. I'm going to study the concept further but wanted to add +1 and say thanks for your efforts!
 
 
  • Post #14
  • Quote
  • Mar 25, 2010 11:09pm Mar 25, 2010 11:09pm
  •  hanover
  • Joined Sep 2006 | Status: ... | 8,092 Posts
I second FXEZ's comments. A very thought provoking concept; many thanks for sharing.
 
 
  • Post #15
  • Quote
  • Mar 26, 2010 12:57am Mar 26, 2010 12:57am
  •  MPP
  • Joined Jun 2007 | Status: Be yourself, everyone else is taken | 2,734 Posts
Hi Bytebodger
interesting idea - thanks for posting it.

couple of questions
1. do you always use the H1 tf to do the counting?
2. how far back do you count, i ask this because i currently have a chart that has a low with a 125 count and a high of 97, essencially this is a down trend based on the difference, but is 8 good enough over a period this large? or would you sit out until we get a count back in favour of the short or a break of the 125 to go long- which makes sense

regards

MPP
 
 
  • Post #16
  • Quote
  • Mar 26, 2010 5:16am Mar 26, 2010 5:16am
  •  Vik22
  • | Joined Nov 2009 | Status: Member | 112 Posts
This idea is hot....imo.
 
 
  • Post #17
  • Quote
  • Mar 26, 2010 7:47am Mar 26, 2010 7:47am
  •  Bytebodger
  • | Joined Apr 2007 | Status: Burning pips since 2007... | 340 Posts
Quoting MPP
Disliked
couple of questions
1. do you always use the H1 tf to do the counting?
2. how far back do you count, i ask this because i currently have a chart that has a low with a 125 count and a high of 97, essencially this is a down trend based on the difference, but is 8 good enough over a period this large? or would you sit out until we get a count back in favour of the short or a break of the 125 to go long- which makes sense
Ignored
1. This trend-spotting method applies to all charts on all TFs- M1 through W1. However, if you are trying to use this method as a key factor in trading decisions, I would probably stick with H1 or longer. More whipsaws present themselves in the lower TFs. I think it might still have value on lower TFs, but I definitely would NOT make a trading decision based purely on these bar counts at the lower TFs.

2. Is there any way you can post the chart you are looking at? I'm asking because I suspect you're not counting according to my rules (which is probably because I haven't explained them very well). I suspect this because it is extremely rare - almost impossible - to have a trend strength in one direction of 125 facing the opposite strength of 97. If the strength in one direction is as high as 125, then the opposite strength will almost always be somewhere between 0 and 20.
 
 
  • Post #18
  • Quote
  • Mar 26, 2010 8:06am Mar 26, 2010 8:06am
  •  MPP
  • Joined Jun 2007 | Status: Be yourself, everyone else is taken | 2,734 Posts
Quoting Bytebodger
Disliked
1. This trend-spotting method applies to all charts on all TFs- M1 through W1. However, if you are trying to use this method as a key factor in trading decisions, I would probably stick with H1 or longer. More whipsaws present themselves in the lower TFs. I think it might still have value on lower TFs, but I definitely would NOT make a trading decision based purely on these bar counts at the lower TFs.

2. Is there any way you can post the chart you are looking at? I'm asking because I suspect you're not counting according to my rules (which...
Ignored
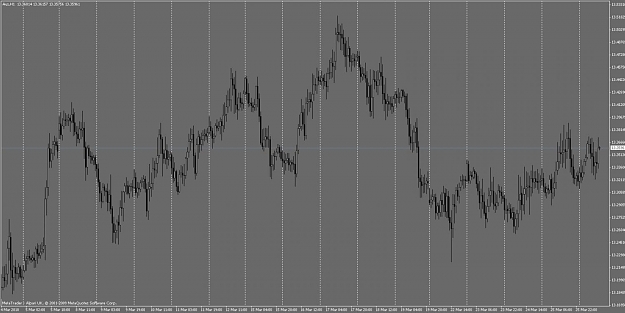
OK here are the charts, i'll remove them later as i got them kinda big so you can see were my low is compaired to the previous matching low - was my first review.

Also i'm looking at 1h 4h daily charts nothing lower

Attached Image (click to enlarge)
Click to Enlarge

Name: 1h.jpg
Size: 93 KB


Attached Image (click to enlarge)
Click to Enlarge

Name: 1h closer view.jpg
Size: 76 KB


Attached Image (click to enlarge)
Click to Enlarge

Name: 1h closer view p2.jpg
Size: 78 KB
 
 
  • Post #19
  • Quote
  • Mar 26, 2010 8:09am Mar 26, 2010 8:09am
  •  MPP
  • Joined Jun 2007 | Status: Be yourself, everyone else is taken | 2,734 Posts
i was only looking at the high compared to high and low compared to low, maybe i miss understood something, are we meant to reset the count once a new direction has been established
 
 
  • Post #20
  • Quote
  • Mar 26, 2010 8:18am Mar 26, 2010 8:18am
  •  luqmanz
  • | Joined Nov 2006 | Status: Member | 690 Posts
good job byte .... this idea is great ...
 
 
  • Trading Discussion
  • /
  • Trend-spotting
  • Reply to Thread
    • Page 1 23456 8
    • Page 1 234 8
0 traders viewing now
  • More
Top of Page
  • Facebook
  • Twitter
About FF
  • Mission
  • Products
  • User Guide
  • Media Kit
  • Blog
  • Contact
FF Products
  • Forums
  • Trades
  • Calendar
  • News
  • Market
  • Brokers
  • Trade Explorer
FF Website
  • Homepage
  • Search
  • Members
  • Report a Bug
Follow FF
  • Facebook
  • Twitter

FF Sister Sites:

  • Metals Mine
  • Energy EXCH
  • Crypto Craft

Forex Factory® is a brand of Fair Economy, Inc.

Terms of Service / ©2023