S&P 500... a couple of perspectives on the S&P. I use this to help my */U trades particularly A/U...
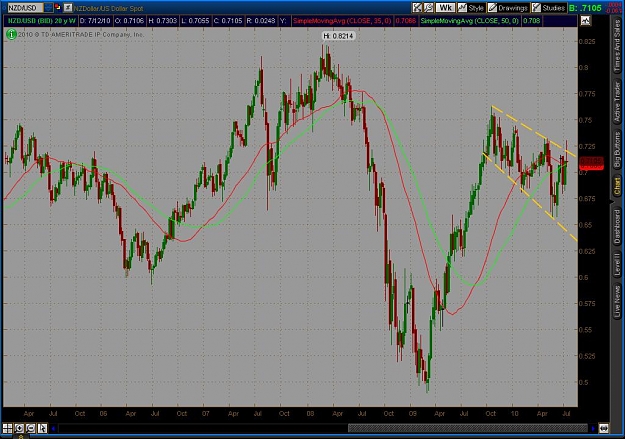
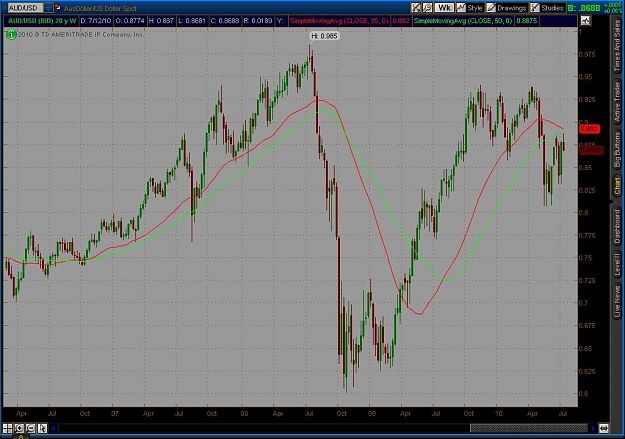
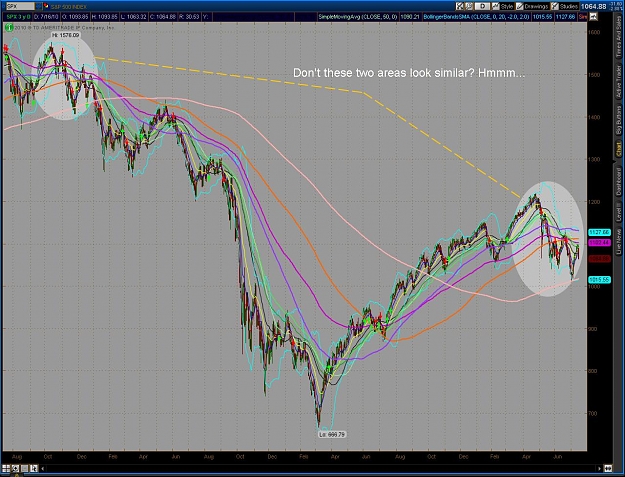
1st chart: This is a 3yr Daily chart and the PA patterns highlighted look eerily the same when the MA's that I use are added to the chart! Interesting.
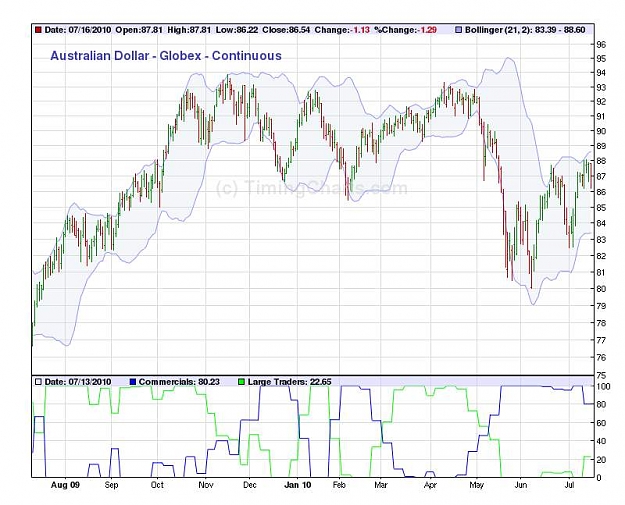
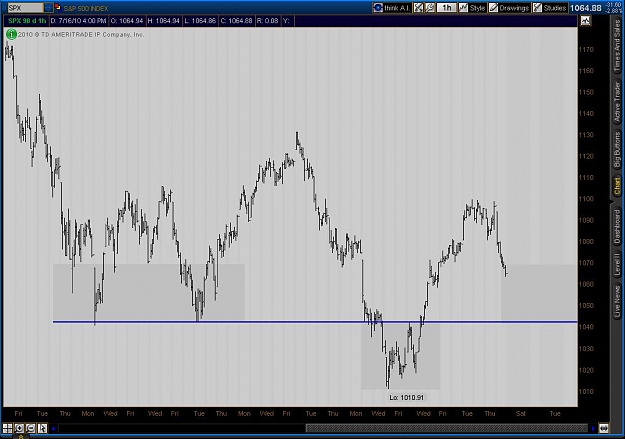
2nd chart: This is a H1 chart and zooms into what kind of looks like an HNS pattern forming... I am not a big fan of the HNS but I still watch out for them.
My short-term outlook: If the S&P 500 sees buying on Monday then it may signal that the past two days of selling is only a short-term low and therefore the buying will continue... If the S&P 500 sees more selling on Monday then it is very possible that a new low on the Daily chart is coming around the corner!
1st chart: This is a 3yr Daily chart and the PA patterns highlighted look eerily the same when the MA's that I use are added to the chart! Interesting.
2nd chart: This is a H1 chart and zooms into what kind of looks like an HNS pattern forming... I am not a big fan of the HNS but I still watch out for them.
My short-term outlook: If the S&P 500 sees buying on Monday then it may signal that the past two days of selling is only a short-term low and therefore the buying will continue... If the S&P 500 sees more selling on Monday then it is very possible that a new low on the Daily chart is coming around the corner!
Attached Image(s) (click to enlarge)
When this baby hits 88 miles per hour, you're gonna see some serious s***.