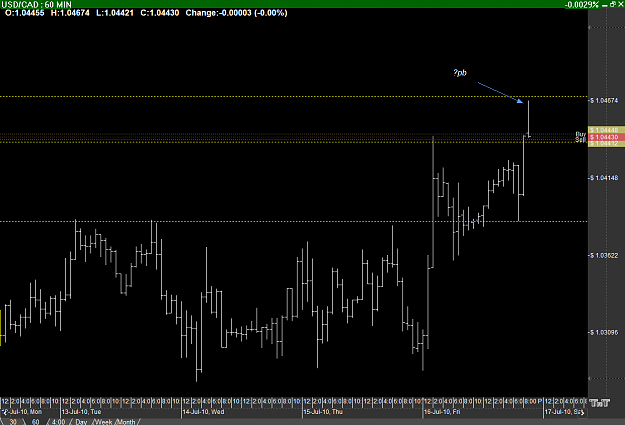
is the blue line a divergence line?
i think u are plotting that div incorrectly.
it looks creative (connecting one MACD low on the left & a high on the right while neglecting/dismissing all the MACD histogram in between that two endpoints), but it doesnt work that way (UNLESS u have been doing it for sometime & it works for u).
plot on price highs, plot on indicator highs. (price is up but slowly turning/moving down)
plot on price lows, plot on indicator lows. (price is down but slowly turning/moving up)
in your chart, price is down & slowly turning up. price made a "U" shape (see July8 - 15), so did MACD..
u plotted on price highs, but MACD is below 0, so u plotted from an MACD low (left), then connected that to an MACD high (right).
again, if u have been doing this for a while & it works for u, then ignore this post.
http://www.babypips.com/school/divergence_trading.html