well, I would always re-enter. No rule to keep me out. Except if news are coming up.
Ignored
hmmm.... next time i'll post a chart and get some input in order to achieve some further clarity in terms of what should or shouldn't be done in such situations.
It is a friday and I am not keen on entering a trade this late. However, what do you guys think of this setup?
Top black SR seems ideal for a short as it is close to a round number as well as the 61% Fib level. PA seems to respond well off this area?
Hope I am getting a bit better Custos... I am going to practice more on FT as well!
Thanks
Ignored
Hi Charles,
Good levels IMO. I just posted it earlier and Jedi master Custos is also looking at it. Scroll a couple of posts down and you will see. There is another good level to short after this one @ 1.51355.
Hi Charles,
Good levels IMO. I just posted it earlier and Jedi master Custos is also looking at it. Scroll a couple of posts down and you will see. There is another good level to short after this one @ 1.51355.
Ignored
Oops...sorry about that man. Should have read through before posting. Been staring at the charts to long Thanks for the heads up!
It is a friday and I am not keen on entering a trade this late. However, what do you guys think of this setup?
Top black SR seems ideal for a short as it is close to a round number as well as the 61% Fib level. PA seems to respond well off this area?
Hope I am getting a bit better Custos... I am going to practice more on FT as well!
Thanks
Ignored
yeah, fridays are always difficult, especially if something is approaching a level. It might just break through only to open on the other side again on monday. So just wait till the open, then you see if it really got rejected or broken through.
This weekend I was trying to install/implement the J16 Trade Manager on Mt4. Due to my full time job I cant watch the trades at all times therefore active trade management has been quite impossible. The only way out of this situation appeared to be utilizing a trade manager EA to manage the open positions at predetermined levels and do a couple of simple tasks such as closing partial positions and moving SL forward to X # of pips once the trade goes in the intended direction or to Break even (if needed).
During my search also came across the following 'Multi Purpose Trade Manager' on FF. This is more advanced than the J16 one. I went through the whole thread to see how it has evolved over two years period and right now looks like it has been matured and debugged quite extensively, at least for the simple tasks I am looking to do. There is quite detailed guide attached with the EA and this post has the most up to date EA file. The author of this EA has now stopped working on any further enhancement and if you look at his comments he wont respond to queries etc. I was thinking that it is still worth trying this EA to perform the simple tasks without having to worry about monitoring it continuously and see which one works better and has better flexibility i.e. J16 or MPTM. I'll try it out during the week and see how it works out.
I was a bit bored today and thought I would clarify with one post how to pick S/R levels. Attached is eur/usd h1 chart with all S/R levels I could identify. It is important, that price bounces off of these very often.
The red squares are instances when price found resistance at or near the S/R levels, and the green squares are when price found support at or near the S/R levels.
Please don't care about the different colors of the horizontal lines, that's just my own personal color code to know in which time-frame I identified the levels.
This weekend I was trying to install/implement the J16 Trade Manager on Mt4. Due to my full time job I cant watch the trades at all times therefore active trade management has been quite impossible. The only way out of this situation appeared to be utilizing a trade manager EA to manage the open positions at predetermined levels and do a couple of simple tasks such as closing partial positions and moving SL forward to X # of pips once the trade goes in the intended direction or to Break even (if needed).
During my search also came across the following...
Ignored
Hi MktScape
Thanks for the heads up. I also recently searched for something similar (mainly to be able to drag drop SL, TP etc lines) to make managment faster for me. I came across what looks to be a pretty powerful manager for MT4. I have not tested it yet but it may be something worth looking at. It is very current with developments having taken place this year still.
I was a bit bored today and thought I would clarify with one post how to pick S/R levels. Attached is eur/usd h1 chart with all S/R levels I could identify. It is important, that price bounces off of these very often.
The red squares are instances when price found resistance at or near the S/R levels, and the green squares are when price found support at or near the S/R levels.
Please don't care about the different colors of the horizontal lines, that's just my own personal color code to know in which time-frame I identified the levels.
Hopefully...
Ignored
Thanks Custos. Your help is very much appreciated here. I read through the No Brainer PDF manual on S/R trading. Thank you so much for having posted the link.
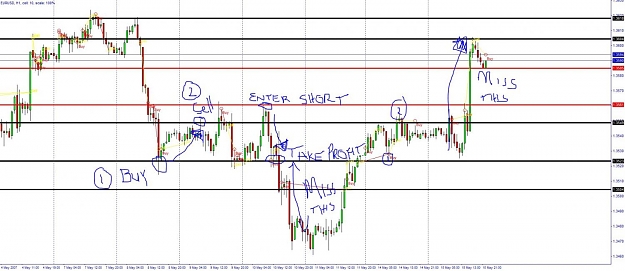
With regards to this "system", do you look for a minimum risk reward ratio before considering a trade? The reason I ask is, there seems to be many opportunities to trade off bounces of Weekly, Daily and even Hourly S/R levels, but sometimes the levels are 20 - 30 pips apart resulting in short profit targets but many trade opportunities. Considering that the rules are to buy off the touches, I find that some trades run over S/R levels resulting in a loss of profit as I would have exited sooner (1st obstacle). I hope the attached chart from FT shows what I mean. How do you deal with this?
Black lines in chart depict Week S/R levels
Red Lines in chart depict Daily S/R levels
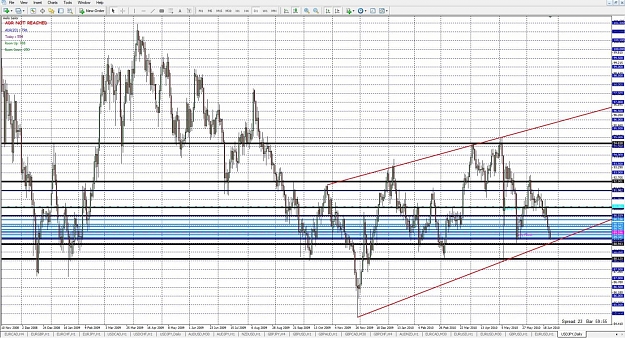
Could this be a potential setup to wait for this week?
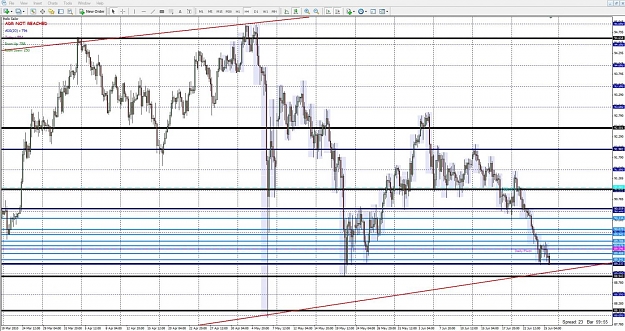
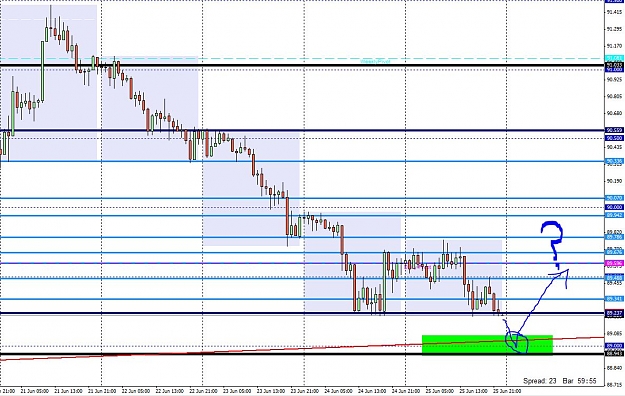
USDJPY Daily, 4 Hourly and Hourly chart attached:
Black Lines depict Weekly S/R Levels
Dark Blue Lines depict Daily S/R Levels
Light Blue lines depict Hourly S/R Levels
The Trend line from the daily chart is near RN 89.000 as well as weekly S.R in the vicinity of 88.943. Do you think this could be a potenial long setup to be taken from the green colour block area? On the other hand, the dark blue Daily S/R may pose a problem on the way up??
Thanks Custos. Your help is very much appreciated here. I read through the No Brainer PDF manual on S/R trading. Thank you so much for having posted the link.
With regards to this "system", do you look for a minimum risk reward ratio before considering a trade? The reason I ask is, there seems to be many opportunities to trade off bounces of Weekly, Daily and even Hourly S/R levels, but sometimes the levels are 20 - 30 pips apart resulting in short profit targets but many trade opportunities. Considering that the rules are to buy off the touches,...
Ignored
hm, I do look at risk reward when levels are really really close, but let's say in general the trades work out so well that R:R is not a huge consideration anymore.
Now to your example: on your first take profit. You could have reentered short. You have to take the wicks into consideration as well for S/R level plotting. Do you see that below your black line, where you took profit, there are some wicks as well? Connect those, then you see that the market allowed you to get in short again. So you could have profited from the next move down as well.
And for your second example: yes that you would have missed.
And in general, there will always be moves you miss. Greed and fear are the worst enemies in trading. You can't be in every move the market gives you.
Also you can just go with the trend only if you want to do that, then you don't take profit and just ride the trend until it reverses. Maybe that suits you better.
I use both strategies in my trading.
Could this be a potential setup to wait for this week?
USDJPY Daily, 4 Hourly and Hourly chart attached:
Black Lines depict Weekly S/R Levels
Dark Blue Lines depict Daily S/R Levels
Light Blue lines depict Hourly S/R Levels
The Trend line from the daily chart is near RN 89.000 as well as weekly S.R in the vicinity of 88.943. Do you think this could be a potenial long setup to be taken from the green colour block area? On the other hand, the dark blue Daily S/R may pose a problem on the way up??
Any thoughts?
Thanks
Ignored
well, it can work of course. But my trendline has already been broken. I am short biased, the weekly is down and the h4 is down. well actually I am not biased at all, if you look at the recent weekly chart, then usd/jpy is just ranging around.
But I gotta say you have a lot of lines on your chart. Look at my eur/usd h1 chart I posted a couple of posts before, it has a lot less lines on it. If you pick levels like brv, then you should only take the most obvious S/R levels with lots of touches, not each and every S/R level.
Thanks for the heads up. I also recently searched for something similar (mainly to be able to drag drop SL, TP etc lines) to make managment faster for me. I came across what looks to be a pretty powerful manager for MT4. I have not tested it yet but it may be something worth looking at. It is very current with developments having taken place this year still.
You have to take the wicks into consideration as well for S/R level plotting. Do you see that below your black line, where you took profit, there are some wicks as well? Connect those, then you see that the market allowed you to get in short again. So you could have profited from the next move down as well.
Ignored
I see what you mean. Thanks for the clarification.
Greed and fear are the worst enemies in trading. You can't be in every move the market gives you.
Also you can just go with the trend only if you want to do that, then you don't take profit and just ride the trend until it reverses. Maybe that suits you better.
Ignored
I must say, trading with the trend using this method should offer more pips. However, on the other hand I like the fact that with this method I can continue trading in ranging markets without waiting for the the major trend again.
well, it can work of course. But my trendline has already been broken. I am short biased, the weekly is down and the h4 is down. well actually I am not biased at all, if you look at the recent weekly chart, then usd/jpy is just ranging around.
Ignored
Must agree, the weekly shows a ranging market for this pair. I re-looked at my MT4 (on GoMarkets) and cannot draw my trend line to look like yours...that major spike down appears to end "higher" in your chart than mine. Makes me wonder why the charts are not identical??
But I gotta say you have a lot of lines on your chart. Look at my eur/usd h1 chart I posted a couple of posts before, it has a lot less lines on it. If you pick levels like brv, then you should only take the most obvious S/R levels with lots of touches, not each and every S/R level.
Ignored
I think the light blue lines are the "over-done" ones making the chart look busier than it should be. These are the recent daily S/R levels and carry less weight in my mind, but I wanted to plot them if only as a means to learn and see how price reacts at those levels. The main important lines are the black and dark blue ones.
Do you draw daily S/R levels or is 4 hourly ones the lowest TF you will plot?
I see what you mean. Thanks for the clarification....
Ignored
depends in which trading mood I am, I might also draw lines on the m15 chart. But normally anything from monthly to h1.
On my h1 eur/usd chart most lines are taken from the h1. That is why I think yours has way too many lines.
and concerning that spike, maybe a data-feed issue on either your side or my side.
And yes, trend trading offers more pips but less trading opportunities. Always a trade-off.
I think the light blue lines are the "over-done" ones making the chart look busier than it should be. These are the recent daily S/R levels and carry less weight in my mind
Ignored
Man, I just read, those are your recent daily S/R levels? I thought those light blue were your recent hourly S/R levels. God. How can you even find so many lines on a daily. You must have eyes like an eagle. Really, cut down on those levels, you gonna get very confused very soon, if you try to find so many levels on a daily chart.
Man, I just read, those are your recent daily S/R levels? I thought those light blue were your recent hourly S/R levels. God. How can you even find so many lines on a daily. You must have eyes like an eagle. Really, cut down on those levels, you gonna get very confused very soon, if you try to find so many levels on a daily chart.
Ignored
I type too quick and therefore made some errors in what I said. Those blue lines ARE hourly
So, to recap -
1. Black = Weekly
2. Dark Blue = Daily
3. Light blue = Hourly
Sorry for the typo guys!! Nevertheless... I still have to cut down!
I was a bit bored today and thought I would clarify with one post how to pick S/R levels. Attached is eur/usd h1 chart with all S/R levels I could identify. It is important, that price bounces off of these very often.
The red squares are instances when price found resistance at or near the S/R levels, and the green squares are when price found support at or near the S/R levels.
Please don't care about the different colors of the horizontal lines, that's just my own personal color code to know in which time-frame I identified the levels.
Hopefully...
Ignored
Thanks Custos that was helpful .... i have been practicing on FxTester on identifiying the levels. One thing that i have done for different TF color codes is to use darker shades in order to blend these line into the black background on my charts.