Beautiful work once again! I was looking for a reason to stay long, but am packing and analysis time is limited. I can't wait to be moved and settled in once again!
Every time you use 'hopium' in a post, God kills a kitten.
I opened couple long positions when E/U first hit the first white support zone,
and successfully closed a half with profits and the rest got stopped out just now.
I actually expected dollar gaining strength, but didn't expect it was going to last this long(2days or longer)
However, I believe either 38.2% or 50% fib retracement area is going to hold, so until both of them are broken, I will stay bullish on this pair
I was just looking at the exact same thing,
but I want to wait for it to go down to the DP and enter long there.
Very interesting how GBP is showing signs of bulls
I opened couple long positions when E/U first hit the first white support zone,
and successfully closed a half with profits and the rest got stopped out just now.
I actually expected dollar gaining strength, but didn't expect it was going to last this long(2days or longer)
However, I believe either 38.2% or 50% fib retracement area is going to hold, so until both of them are broken, I will stay bullish on this pair
Ignored
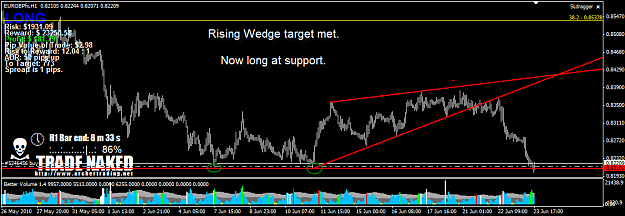
Chart update:
This could be a fake bull movement, but if E/U does continue upside, then my target is shown on this chart.
I do not want to go too far ahead, but E/U could be forming H&S pattern at my 1st TP area.
Could you please explain how you trade this kind of pattern in terms of entry, stops and profits?
Entry:
Do you give some room (a buffer of a 10/15 pips) higher to go long, lower to go short from the trendlines once they got broken?
What about stops and profits? thanks !
Ignored
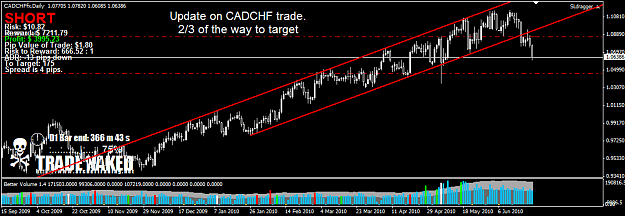
Went long at the TL with the SL at prevoius low(.2280)(stopped out -18). Let it breath now and enter at retest area , I prefer to wait for a penetration and enter on the way out (around prev. low). See pic.