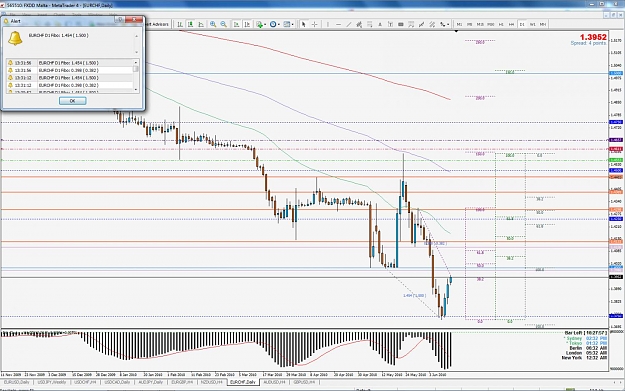
" No, . . its not at a swing High" stop right there. Then its not setup we would take . . remember back to basics.
Also, get rid of the Fibs . . its not the 38.2 that holding it up its the 1.4600 PPZ level. The 38.2 fib level is a retracement level to go long (in this case) once Price passed this level is no longer a valid Ret. level. Also its a confluencing tool meaning it has to line up with a PPZ level.
Ignored
Hey Jarroo,
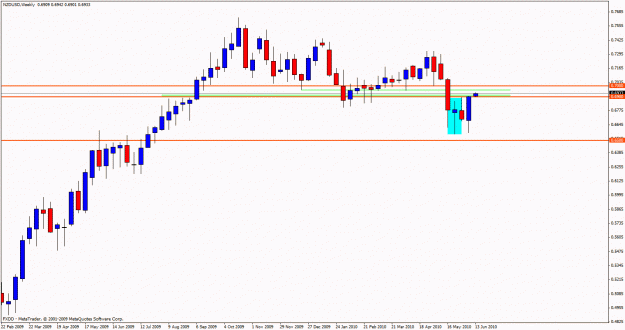
To add to this, would we put less importance on the fact that there is a BEOB because of its location? Meaning there is a small up trend and BEOBs signify a continuation pattern, downward move.
Looking at the 365, 150 & 50 EMAs in such a downturn, I imagine we may possibly see some Bearish PA?
I am not sure about the role of the EMAs, I know we use them as S & R and as confluence but in such a downturn of the EMA as we see on Major TF M1, W1 does this make us be more inclined to have a bearish bias in PA or is this pure counter trend setups we are looking for?
Ignored
EMAs . . . . as a confluencing tool with S/R & PPZs.
More of a Bearish bias.
We need a whole lot bigger PA to counter that down trend.
Indicators show the past. Price Action "Indicates" the future.
Hey Jarroo,
To add to this, would we put less importance on the fact that there is a BEOB because of its location? Meaning there is a small up trend and BEOBs signify a continuation pattern, downward move.
Ignored
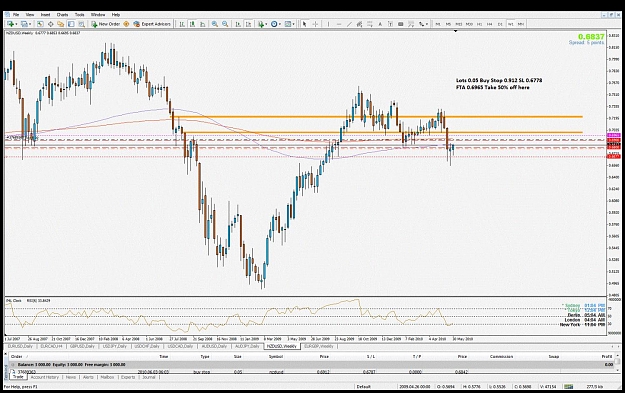
Well Yes (I think, if I inderstand you correctly), One thing that the BEOB shows when they're not swing High or don't have any other supporting confluences, like a wedge breakout or breakout pull back or etc., they can be very risky to trade.
But as confirmation that the down trend is still strong or going on then Yes. Bearish/Bullish PA in a down/up trend, no matter where they are located, is always a good confirmation of a continuing trend.
Indicators show the past. Price Action "Indicates" the future.
Rac-man meanig raczekfx? He would go for a touch trade wouldn't he? Touch trades are a no-go zone for me, at least for now. I still have to develop that specific feeling for price, call it intuition or whatever. Raczek amazed me with his trades to the point of disbelief.
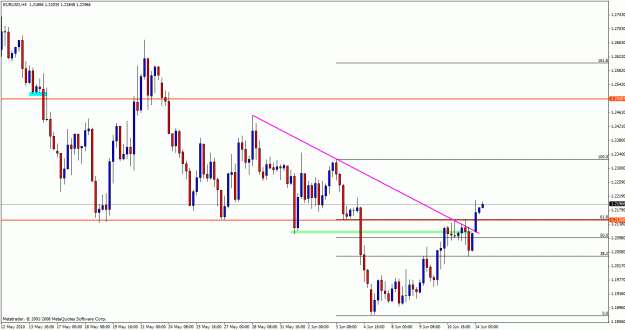
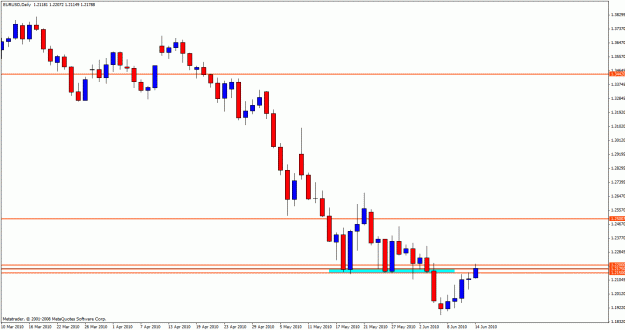
Of course the 1.2150 level stays valid throughout the whole potential move, giving hints, on where the bulls would want go.
Pls point out any flaws of my reasoning, or hints what to add to the analysis.
Its a classic Rac (Raczek) setup. . . Support turning into Resistance (or a PPZ level), 61.8 fib, trendline confluence . . this is the KABoom setup. Your other areas you have noted are ok but for now this is the setup.
The fact that it didn't go Kaboom could be telling, meaning that there might be something else going on. . . .time and patience will tell for sure but i like its odds for going down.
Ignored
Hey proletary.
This is what I meant about "something else going on". Price broke through to the upside, pretty strong too.
That's the beauty of PPZ levels, they are "flip zones" meaning there's usually a reaction sharply in one direction or the other. So when a strong level, like the 1.2150 doesn't react as strong as we would like to see based on the strong confluence of the level. Support turning into Resistance. The down trend may be stalling out or Price is just hanged around his level, knocking on the door to knock it down.
Don't get me wrong, It did give a reaction and some pips were offered and taken. But . . . . something else maybe going on.
Attached Image (click to enlarge)
Indicators show the past. Price Action "Indicates" the future.
This is what I meant about "something else going on". Price broke through to the upside, pretty strong too.
That's the beauty of PPZ levels, they are "flip zones" meaning there's usually a reaction sharply in one direction or the other. So when a strong level, like the 1.2150 doesn't react as strong as we would like to see based on the strong confluence of the level. Support turning into Resistance. The down trend may be stalling out or Price is just hanged around his level, knocking on the door to knock it down.
These support levels 1.2200, 1.2175, 1.1250 these are all areas of the PPZone that can fullfill this Support into Resistance. Or you could look at it as Support already turned into Resistance last week and now were turning this level back into Support. That down trend is tough to fight.
Attached Image (click to enlarge)
Indicators show the past. Price Action "Indicates" the future.