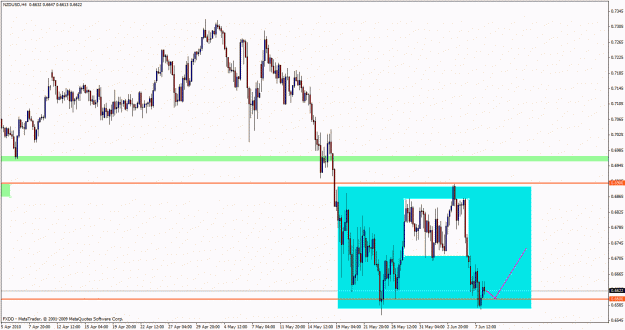
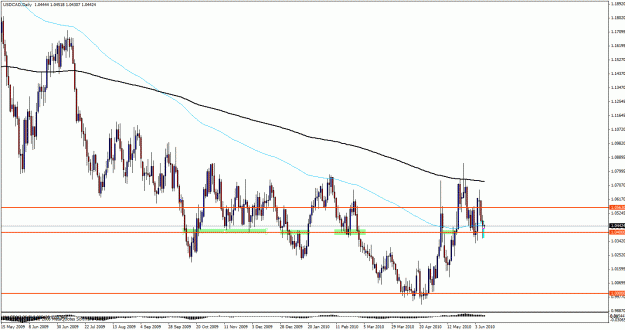
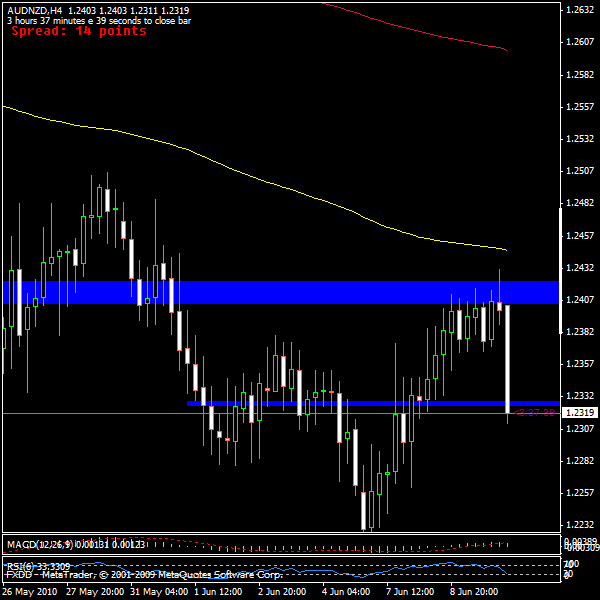
Looks like we could be in a consolidation area on the Daily. The Weekly clearly shows a strong trend downward. I'm sure that trend is eyeballing the .6500 (BRN).
If on the 4 hour, I would like to see another swing high maybe up by this white box, for some nice bearish PA. But then again the downward trend could be strong enough for even a bearish IB at the .6600.
Ignored
Attached Image(s) (click to enlarge)
Indicators show the past. Price Action "Indicates" the future.
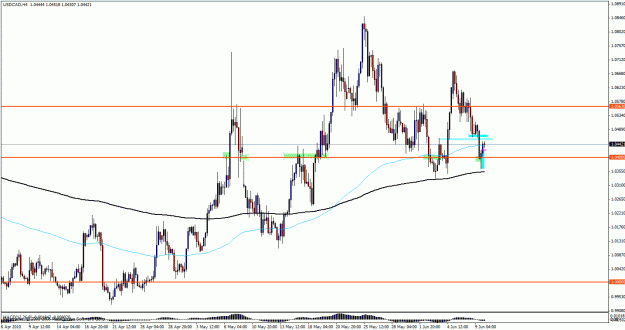
Looks like we could have another i4b at the round number 1.1000.
Pros:
I4b
VBRN
Previous bar resembles a BUOB (not that I would trade it on it's own merit)
With trendif taken long.
Cons:
Choppy pair
The 1.1140 area previous highs look like a good possibility if it breaks north. I am not interested in a short on this pair even though it could be a good trade straddling the I4B.
3 bars ago was a BEOB which could still be in play. It's in the middle of a range and choppy though so easy pass for me.
Ignored
Funny you mention that fxp. I actually like the long play more because of the BEOB. Reason being: All those that took it short going into a price flip are probably getting nervous about it right now. It's been 3 days and no movement. Also, yesterday's doji equates to indecision after a bearish bar, which means to me that the momentum has been nullified.
Thanks for the input fxp, I appreciate the feedback to get the gears going.
-- Danny
Ignored
Now your talking. I like your way of thinking there. I will watch with interest.
When looking for a retracement to go long we draw from Swing Low to Swing high.
When looking for a retracement to go short, we draw from swing high to swing low
Example of looking to go short(and just flip it to go long).
Just think about the retracment numbers as percentages. The lower numbers should be closest to current price as the retracement represents a closer % of the previous move. As you move further away it is a larger retracement/ percentage of the move.
|
Joined Mar 2010
|
Status: The Pipping Tom
|184 Posts
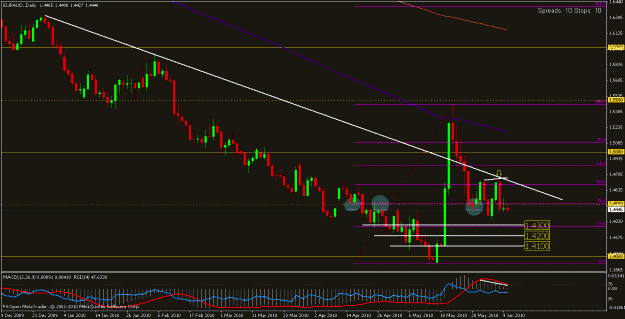
1.45 support breached by the BEOB and yesterday's bar didn't make it although it try to. Confluences are slight divergence, fib, bearish TL. Low risk entry above 1.45, with a couple of targets based on the traffic, 1.43 is could be strong enough to hold it though. The only thing keeping me from entering is the giant BUOB in monthly...
Hi everyone, this is my first post in this thread, but have already read a ton of the material, and have learnt so much already. Thanks to all, especially the senior members, who still take time to help others.
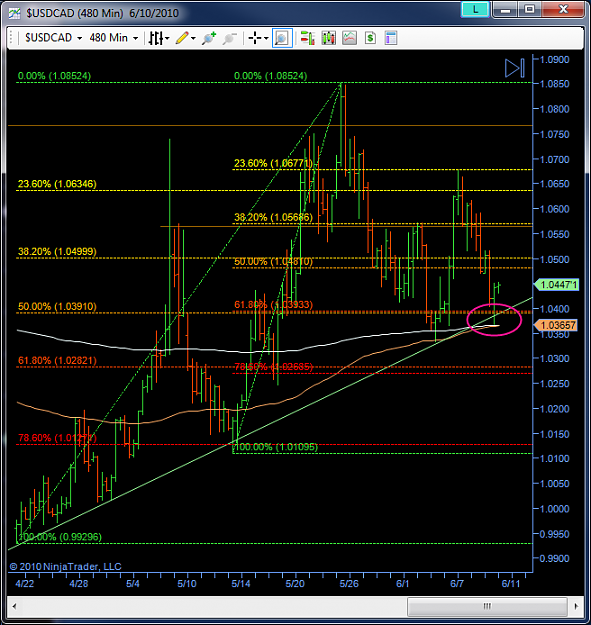
Just posting these charts to receive feedback as to whether the PB on H8 would be a reasonable trade. On H8 it has bounced off quite a bit of confluence:
- both 365 and 150 ema's
- trend line
- confluence of two fibs at 50% and 61.8%
My concern is whether I am trading into too much traffic. I thought my first trouble area would be around 1.0563.
Grant
Attached Image(s) (click to enlarge)
“Make everything as simple as possible, but no simpler.”
– Albert Einstein
Hi everyone, this is my first post in this thread, but have already read a ton of the material, and have learnt so much already. Thanks to all, especially the senior members, who still take time to help others.
Just posting these charts to receive feedback as to whether the PB on H8 would be a reasonable trade. On H8 it has bounced off quite a bit of confluence:
- both 365 and 150 ema's
- trend line
- confluence of two fibs at 50% and 61.8%
My concern is whether I am trading into too much traffic. I thought my first trouble area would be around...
Ignored
Hey Grant
welcome, glad to hear you are learning a lot that's what we love and questions LOL
Yes you are correct this isn't the best trade in terms of space, but we can still gauge where the trouble areas are and then make an educated decision if it is still worth it(that answer will vary). Your target although may be hit is a bit optimistic in terms of what could stop it on the way up. There is a 2 bar low just above us here and then further we would be trading into the 1.0500 major round number and PPZ.
Hi everyone, this is my first post in this thread, but have already read a ton of the material, and have learnt so much already. Thanks to all, especially the senior members, who still take time to help others.
Just posting these charts to receive feedback as to whether the PB on H8 would be a reasonable trade. On H8 it has bounced off quite a bit of confluence:
- both 365 and 150 ema's
- trend line
- confluence of two fibs at 50% and 61.8%
My concern is whether I am trading into too much traffic. I thought my first trouble area would be...
Ignored
Welcome from the shadows Grant.
Just to add from Mike.
I took the 4 hour PB, a bit small though. But the location is very strong.
Those are all good confluences, Grant, but it seems that you are missing the main one, the 1.0400 Weekly/Daily PPZ level. PPZ levels are at the core of what James16, Mike and many others teach here. Without the PPZ level those other confluences have no meaning, (imo).
Yes, too agrressive on your target. Previous bar Highs/Lows, PPZ level (in my case , the 4 hour PPZ levels), RNs, etc.
Jim
Attached Image(s) (click to enlarge)
Indicators show the past. Price Action "Indicates" the future.
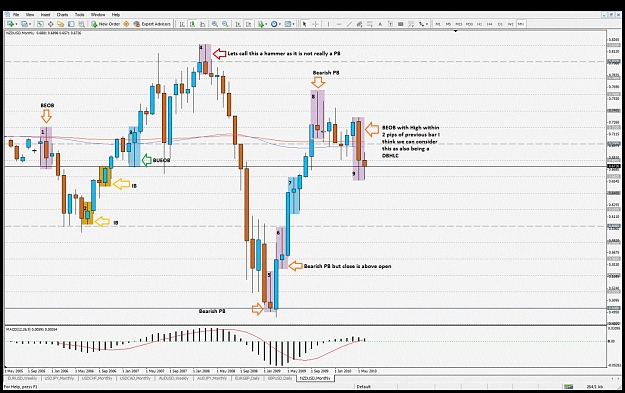
Now IT check that chart out, how you can clearly see a triple bottom, and price touches the same area, boucnes - then moves AWAY, notice the 3rd time back we got a BUOB.
This is what we want to do
Mike
Ignored
Mike,
In this case we should have entered on the break of the wick of the BUOB and then set targets as per FTA.
In this case we should have entered on the break of the wick of the BUOB and then set targets as per FTA.
Cheers
Novice 198
Ignored
Hey Novice
Yes if you are trading on the conservative wait for a break, then your buy is above the high of the BUOB(some amount of pips you are comfortable) and then proceed to manage it according to what is your plan
Joined May 2010
|
Status: HCR-LCS SFP
|6,026 Posts
Jarroo & indeed anyone else.
Obviously, I am lacking something basic and racking my brain out to try and find it.
This rant, is probably going to be long so, I will post it in pieces as I work out what it is I am missing, as I work it out or don’t work it out, whichever as, I think the process irrespective of the conclusion is important.
I have been really thinking about the TREND, what is it? Is it a series of bars, is it a single bar on a large TF, when does it start, when does it end? And, probably most importantly, how do we discover when it starts and when it is likely to end. I don’t mean, when it starts so we can jump in at the very start of it, I mean so that we can ride with it like paddling a canoe down a river, rather than trying to paddle the wrong way up a waterfall, we all know where trying to paddle up a waterfall leads to.
Recently, since I am exiled to the weekly and daily charts, I have been looking at the monthly candles quite a lot since Jarroo mentioned that NZD/USD weekly bar and I got into that discussion with TD about that GBP/USD H4 PB.
So, I am trying to work out which of these candles will show us the trend and allow us to take a trade with the flow of the larger TF with confirmation of that same direction on lower TF.
Figure 1:
9 candles chosen really at random and includes some candles that did not work out for better analysis.
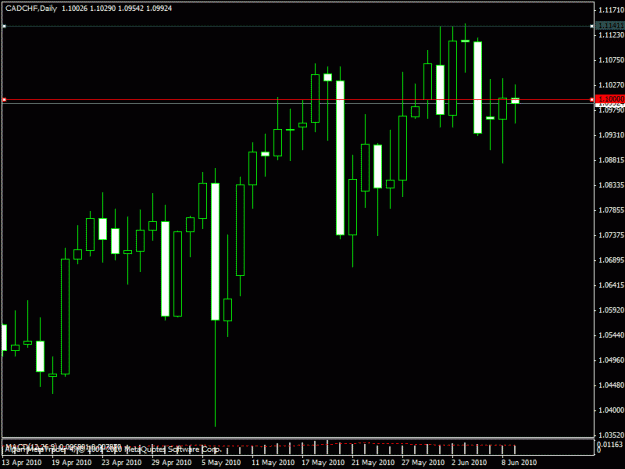
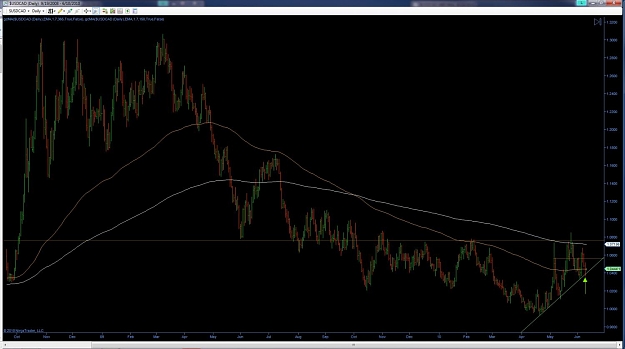
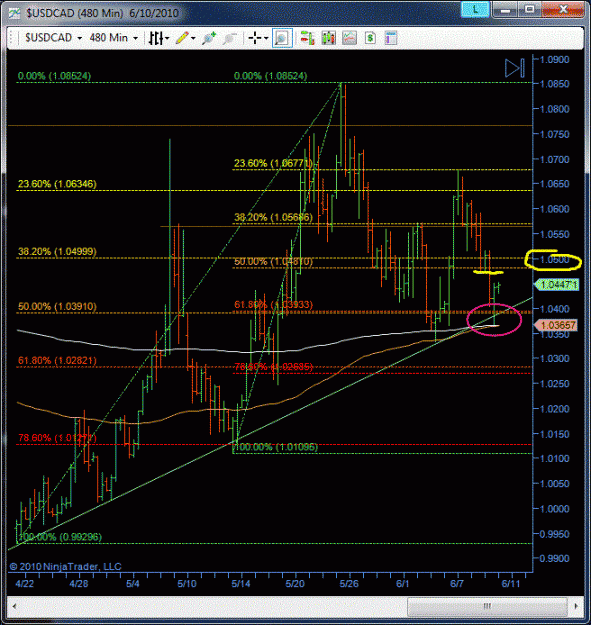
choppy pair indeed. but looking at Daily to monthly, specially monthly chart, u will see cad is the dominant currency.
we may see new 2010 highs, possibly 1.1300 - 1.1700 area.
as usual, this post will be a part of my 'learning archive', so let's see in a few weeks/months.
Yes if you are trading on the conservative wait for a break, then your buy is above the high of the BUOB(some amount of pips you are comfortable) and then proceed to manage it according to what is your plan