I thought I will just put in words what I am looking at on Aussie. This is to just clarify what I am thinking. More importantly, I would like you guys to poke holes in it so that I can hopefully plug them and get better.
A brief intro- I basically use fibs and look at PA at the various levels. My levels are a little different than usual - I dont use 23.6 but rather 21.4. This makes my fibs symmetric around the 50 level. This also lets me draw fibs only one way - high to low. I usually use fib extensions as my targets.
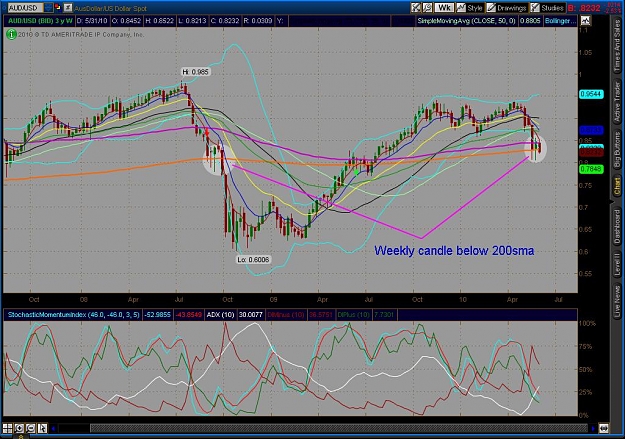
Now to the Aussie. The weekly and daily are in downtrend, making LHs and LLs. The first high was 0.9848, then low was 0.6008, followed by a LH @0.9404. What I am looking for is a new LL. Another thing is Aussie simply loves the 78.6 level and most of interesting PA happens there.
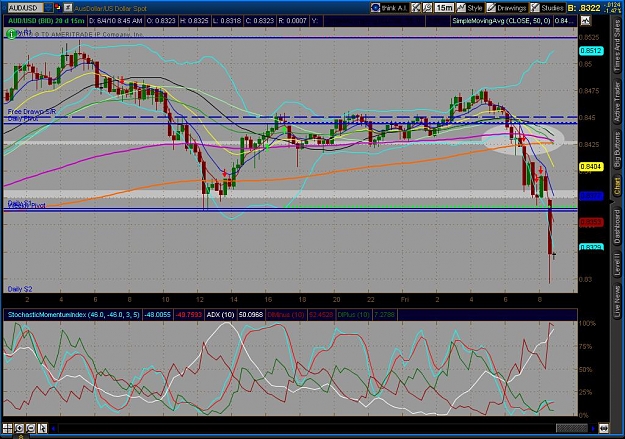
Here is a daily chart that shows previous week's actions (this can be seen on weekly and 4H) as well. Notice the fib drawn from 0.9404 to 0.8577. The -61.8 level coincides with 0.8065, level from which it bounced off last week.
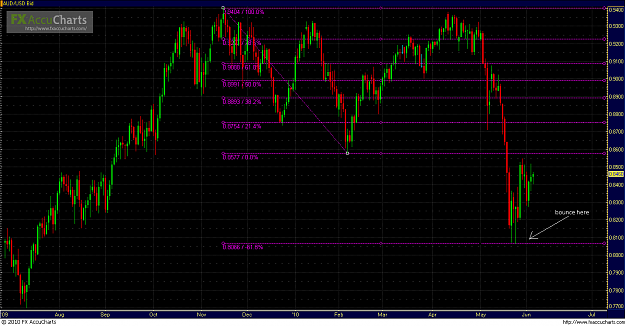
From this chart, the 78.6% level is around the 0.9117 mark. This is one of the areas I would think the Aussie could retrace to. It still maintains the downtrend (doesnt break 0.9404) and satisfies the fib criteria.
EDIT: when I say this chart, I meant a fib from 0.9404 to 0.8065. I didnt put in that chart. Sorry about that...realized it now after waking up.
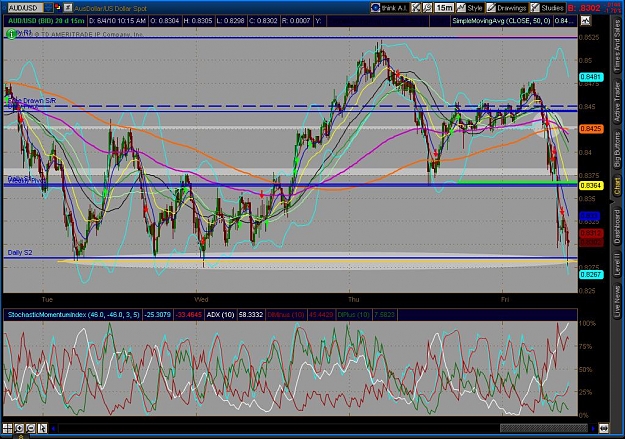
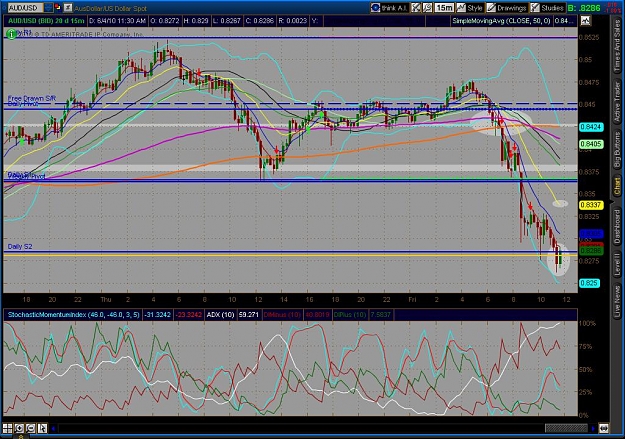
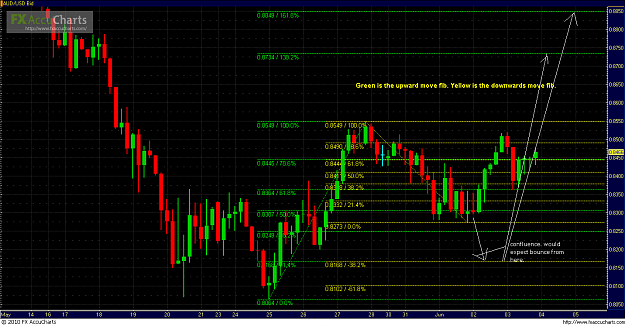
The 4H gives me moves within this move. The current retrace from 0.8065 took it to 0.8549, then to 0.8274. If I draw a fib between 0.8549-0.8065, I see the 21.4% level is 0.8168. This also coincides with the fib extn for 0.8549-0.8273 (78.6 of which is around 0.8490 adhered to by the down move last night). This would be where I would be looking for a bounce. This would also make a HL and confirm the temporary uptrend.
The bounce should take it to 0.8734 (138.2) or 0.8849 (161.8) levels.
Here is the chart..I cleaned it up a bit to show just the fibs I am talking about above ..
Just a final word of caution - all this is based on the assumption that 0.8065 is confirmed as swing low. On weekly charts, it is not yet confirmed as swing low. If it is not, then I would think the Aussie would go further down to 0.73 levels.
Just my 2c on Aussie. Pls let me know your comments. All feedback appreciated.
Thanks Saxon for letting me post this rambling analysis. Bet you didnt think it was gonna be this long
A brief intro- I basically use fibs and look at PA at the various levels. My levels are a little different than usual - I dont use 23.6 but rather 21.4. This makes my fibs symmetric around the 50 level. This also lets me draw fibs only one way - high to low. I usually use fib extensions as my targets.
Now to the Aussie. The weekly and daily are in downtrend, making LHs and LLs. The first high was 0.9848, then low was 0.6008, followed by a LH @0.9404. What I am looking for is a new LL. Another thing is Aussie simply loves the 78.6 level and most of interesting PA happens there.
Here is a daily chart that shows previous week's actions (this can be seen on weekly and 4H) as well. Notice the fib drawn from 0.9404 to 0.8577. The -61.8 level coincides with 0.8065, level from which it bounced off last week.
Attached Image (click to enlarge)
From this chart, the 78.6% level is around the 0.9117 mark. This is one of the areas I would think the Aussie could retrace to. It still maintains the downtrend (doesnt break 0.9404) and satisfies the fib criteria.
EDIT: when I say this chart, I meant a fib from 0.9404 to 0.8065. I didnt put in that chart. Sorry about that...realized it now after waking up.
The 4H gives me moves within this move. The current retrace from 0.8065 took it to 0.8549, then to 0.8274. If I draw a fib between 0.8549-0.8065, I see the 21.4% level is 0.8168. This also coincides with the fib extn for 0.8549-0.8273 (78.6 of which is around 0.8490 adhered to by the down move last night). This would be where I would be looking for a bounce. This would also make a HL and confirm the temporary uptrend.
The bounce should take it to 0.8734 (138.2) or 0.8849 (161.8) levels.
Here is the chart..I cleaned it up a bit to show just the fibs I am talking about above ..
Attached Image (click to enlarge)
Just a final word of caution - all this is based on the assumption that 0.8065 is confirmed as swing low. On weekly charts, it is not yet confirmed as swing low. If it is not, then I would think the Aussie would go further down to 0.73 levels.
Just my 2c on Aussie. Pls let me know your comments. All feedback appreciated.
Thanks Saxon for letting me post this rambling analysis. Bet you didnt think it was gonna be this long