As nice as volatility is on jpy crosses, I find they are all too correlated to trade more than 1/2, if only looking at a few pairs....
Ignored
thanks for your reply. Very true, they have a very high volatility. Still have to think about the best combo as well, but thank you guys for your hints. Helps me to get around this problem much faster.
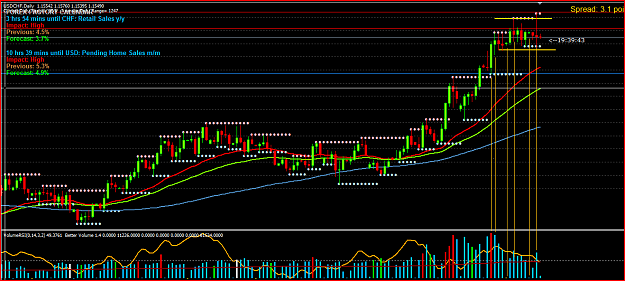
Reposting this chart on a daily TF .... this still appears to be an impending high probability reversal. For a change, i have marked the chart with some vertical yellow lines starting from left to right ... I'll attempt to use the language as used in volume spread analysis to explain whats happening.
We are hitting a resistance zone.
Starting from left to right:
1-Climactic high volume with large up bar = Hidden Potential selling + Effort to Rise (as per Wycoff language)
2- Next bar confirms that selling came in on high volume and effort to rise on previous bar failed.
3- Narrow range up bar with ultra low volume = No Demand
4- Price rejection at higher than average volume - (Pin Bar / up Thrust)
5- Another no demand bar on very low volume - this would also confirm earlier no demand bar.
6- Another pin bar on higher than average volume.
So far this pair is still right on tract for a reversal. let see if & when it really starts to go down.
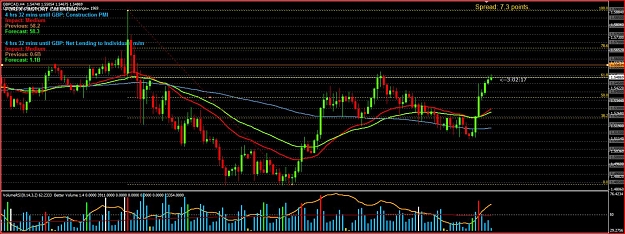
This one is entering a confluence zone , resistance is up above. Right now its at 61.8 fib + RN. Looks like it will test the resistance via long on bar before reacting.
Also look at volume red bar , which is the climax volume and as we can see price pulled back about 40% ...after that bar range started shortening and volume is gradually decreasing i.e. bearish activity.
Interesting read. Now question is: is this just an interesting read or useful tradeable information?
Would be great if you can post a chart in which the volume has lead you to enter a trade. Cause after all we are here to trade, not analysis per se.
anyways, quite interesting.
Reposting this chart on a daily TF .... this still appears to be an impending high probability reversal. For a change, i have marked the chart with some vertical yellow lines starting from left to right ... I'll attempt to use the language as used in volume spread analysis to explain whats happening.
We are hitting a resistance zone.
Starting from left to right:
1-Climactic high volume with large up bar = Hidden Potential selling + Effort to Rise (as per Wycoff language)
2- Next bar confirms that selling came in on high volume and effort to...
Interesting read. Now question is: is this just an interesting read or useful tradeable information?
Would be great if you can post a chart in which the volume has lead you to enter a trade. Cause after all we are here to trade, not analysis per se.
anyways, quite interesting.
cheers
Ignored
Hello Custos,
When i started learning about trading stocks, i learned that volume (representing sentiments/ involving actions of professionals) is the key part of the whole puzzle of chart reading/analysis and then reaching a decision as to whether entering a particular trade has the max odds on the side of the trader. I would quote 1 book particularly, this is a 1930 classic:
Mr Wycoff is the guru in understanding the market psychology combining PA and Volume. VSA is the extension of Wycoff work. I haven't been too comfortable in reading price action without volume as it doesn't give the additional confirmation/confidence about the underlying forces behind the PA. So when i learned that volume work in Forex as well (given its from a reliable/large broker) then i added it immediately to my charts.
So, in my opinion knowing about combining price spread provides valuable insight into professional activity aka smart money, and when it happens near the demand/supply zones i.e support / resistance confirms the bias of whats cooking and makes us better in the art of chart reading. Thats how i have always learned/known it.
Therefore volume alone wont be sole factor to enter into a trade but it will give the additional confidence in knowing that the odds are on our side as propagated by the professionals.
I took the trade on GBP CAD H4...it worked out well.
I use volume is futures and stocks quite well as an additional confluence. However, volume in spot forex is not accurate. It is nothing more than a tick display - i.e. display of number of trades - which is dependent on your data feed. I would not use volume in spot forex for the above reasons.
I use volume is futures and stocks quite well as an additional confluence. However, volume in spot forex is not accurate. It is nothing more than a tick display - i.e. display of number of trades - which is dependent on your data feed. I would not use volume in spot forex for the above reasons.
Ignored
Hello,
I have known the same info about why not use volume in forex and i havent applied it for quite some time until i came across Tom William book Mastering the Markets and some of their seminars and the VSA thread on FF.
ESignal has 200 major contributing banks and other financial institutions providing the data therefore they are the best source for volume however expensive. The VSA thread on FF there was a comparitive study done on various broker vol feeds and how it compares to eSignal (being the benchmark due to the largest contributing base) and the finding were a FXCM feed is quite close to eSignal and therefore being used.
One thing to keep in mind that in forex we are mainly interested in comparing volume bars and not necessarily knowing what the total volume. If you see the chart i posted earlier ....i believe its quite obvious as to what story volume is telling.
I changed my perspective on volume based own study, observation and knowing that professional syndicate traders such as Tom Williams also endorse it. If you like you can read Tim william eBook ....do a search in VSA thread and its there as an attachment. I am sure it will broaden understanding.
hm, gotta read more into that, right now I don't know what to think of volume per se.
Also, I think randomperson is right to say that we don't have complete volume information.
I just imagine this scenario. Let's say we have volume information of 70% of the market. Now goldman sachs is going in with a major order, which is not covered by our 70%. Now actually the market is on high volume, but we don't see the volume, since we don't have goldman sachs in our volume feed.
Having said that, I think it can be used as an extra confirming factor in conjunction with PA. But I guess it's up to every person to test that out for themselves.
Anyways, thanks for sharing, gonna read up on your recommended resources.
Hello Custos,
When i started learning about trading stocks, i learned that volume (representing sentiments/ involving actions of professionals) is the key part of the whole puzzle of chart reading/analysis and then reaching a decision as to whether entering a particular trade has the max odds on the side of the trader. I would quote 1 book particularly, this is a 1930 classic:
Having said that, I think it can be used as an extra confirming factor in conjunction with PA.
Ignored
Yep ...that what I am using it as and found it to be helpful.
EDIT:
I have put together some links here. Also is the link to the vol addon (Better Volume v1.4) for MT4 and its explanation docs....I hope it would be a good read.
Are you watching only 5 currencies or you have increased the trading TF so that you get less signals
Ignored
I am watching now only 5 currencies on the h1, cause I like the "entry-frequency". Every two hours or so I get a new signal. Also, if I watched more pairs, I will get too much of the same market. Meaning, if one jpy moves down, most of the other jpy's will too.
Well, but let's see how that works out, still not so sure which pairs are the best , but gonna try a few out.
Ignored
Yes ..get a feel for the better ones ...espacially the non co-related, Highest liquidity and stable price action.
By the way (in case you missed it) I have added the links for the following in my previous posts:
1- Mastering the Markets -By Tom Williams
2- Better Volume Indicator - All it does it apply color to the default volume
bars in MT4 and when you'll put the cursor on the bar it will give the
description.
3- Explanation document for the above indi ... on the meaning of each bar
4- Importance of Background in Analyzing Price Action.
5- List of data contributors for eSignal
Yes ..get a feel for the better ones ...espacially the non co-related, Highest liquidity and stable price action.
By the way (in case you missed it) I have added the links for the following in my previous posts:
1- Mastering the Markets -By Tom Williams
2- Better Volume Indicator - All it does it apply color to the default volume
bars in MT4 and when you'll put the cursor on the bar it will give the
description.
3- Explanation document for the above indi ... on the meaning of each bar
4- Importance...
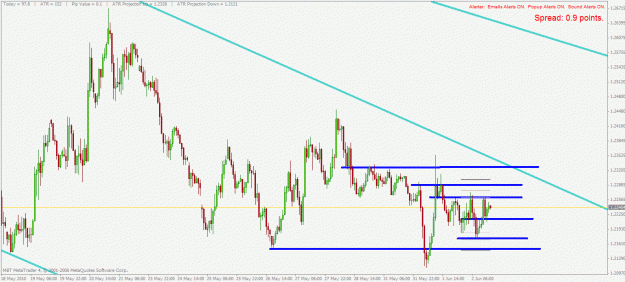
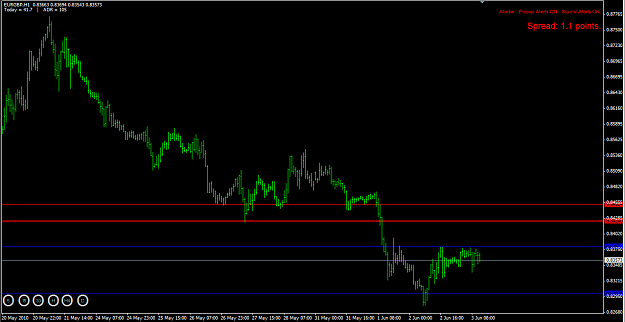
A solid resistance level with 2 confluence level is up above. Anyone else watching this.
Custos , what do you think and how about the placement of limit sell and SL which i have placed on the chart?
Cheers
Ignored
the limit is okay, the stop is a bit too tight, I would put it above the last high at around 0.8480. But of course then the R:R is not very favorable anymore. So you gotta decide on the trade-off, if you are willing to accept a less favorable R:R because of a bigger stop vs. a higher risk of getting stopped out because of a tighter stop.
I just looked around in the forex factory forum for some quality range trading threads. Quite amazingly, besides james16 there are not really good threads concerning that topic in the forum (at least I haven't found them).
Very interesting actually, since the market is ranging around more often than it is trending. Maybe range trading is just too difficult for most people, and that's why there is not more written about it.
Or do you guys know any good threads about range trading?
So, I've been working on testing a range trading methodology the last couple of days. Astonishingly, it does remarkably well.
The basic idea is:
1. Mark up the chart with S/R levels
2. When price approaches an S/R level, enter (in expection for a bounce) and put your stop behind the next (e.g. lower) S/R level and Profit target before the next (e.g. higher) S/R level.
3. If price breaks the S/R level, wait for it to hit the S/L or to retest the broken S/R level to enter now at the opposite direction and close out the losing trade.
That procedure...
Ignored
hmmm....
seems very interesting.
i suppose this is the strategy you developed to trade ranges? or am i wrong in assuming this?
could you give me a visual example if you dont mind Custos?
also, with regards to range trading i think one of your safer bets would be the j16 thread.
sos cant help there
cheers
pip
EDIT: Wont the BRV thread contain range trading since its based on s/r bounces? just a thought but i imagine you've already checked it out.