G/U is entering my sell zone and
U/C is entering my buy zone
How to determine thru code which chart window has focus 0 replies
Charts, Charts, Charts! 1 reply
Link Charts & Floating Charts 4 replies
Forex Daily Charts Scanning “price action in and between charts” 2 replies
Which charts to believe?? the best charts' source ? 19 replies
Disliked
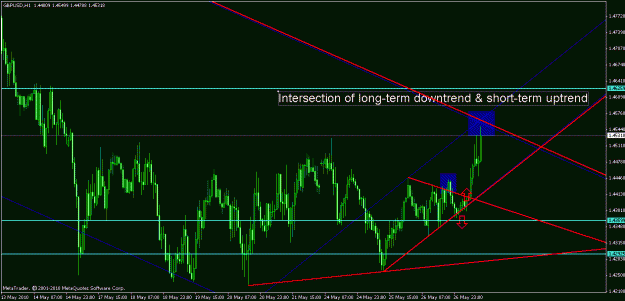
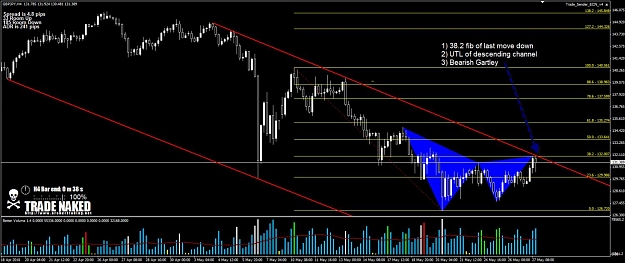
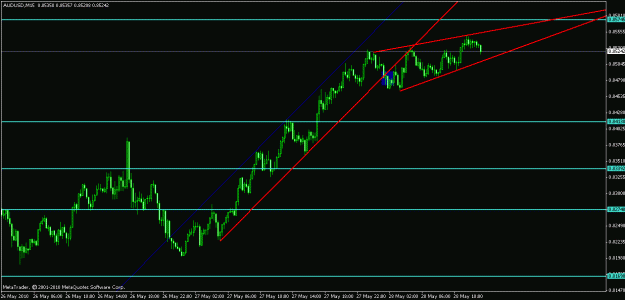
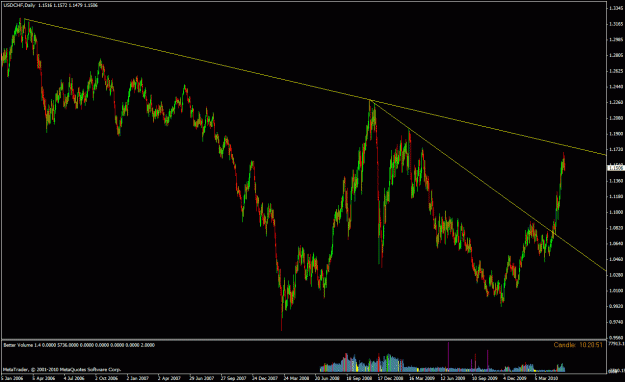
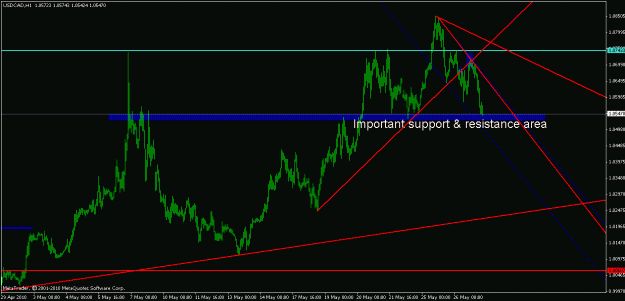
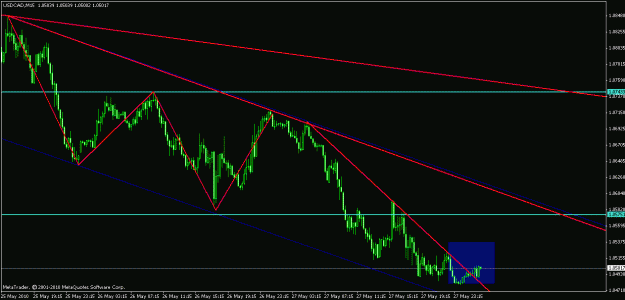
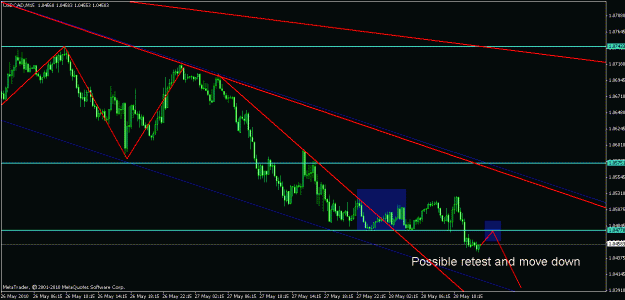
Third test of the broken trendline.
I am not so confident with this one.
But 61.8% retracement level+retest are enough for me to risk 40pips to aim for 80-100pips
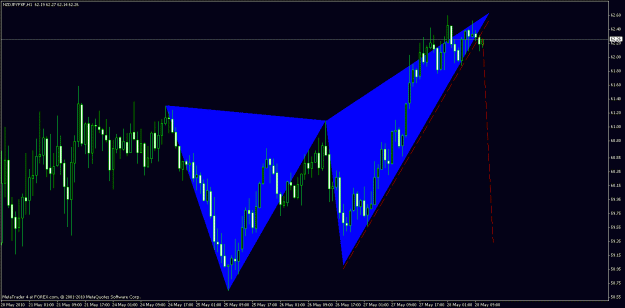
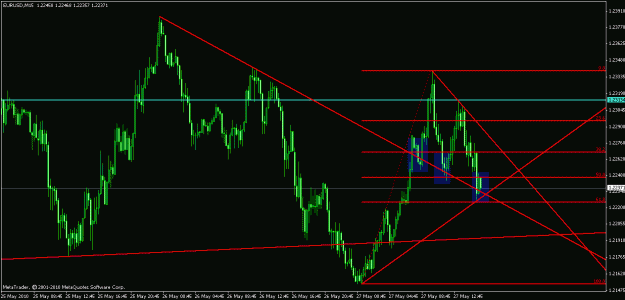
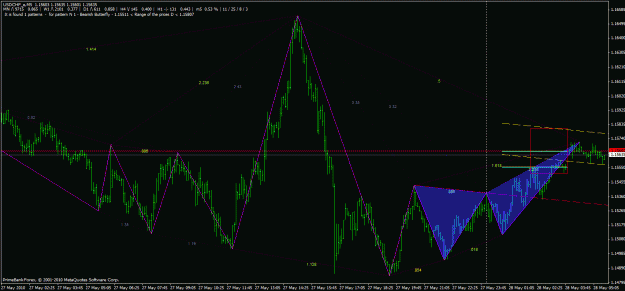
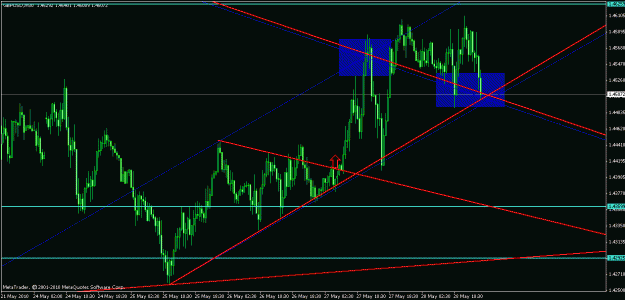
Ignored
DislikedThis could be a bull flag forming,
but since the trendline is broken for now,
I have entered a short position.
1st TP is the Daily Pivot PointIgnored
DislikedI am not trading this pair today,
but the short-term trendline was just broken.
Maybe a possible move up to the upper trendline.
I would place SL at the session low and TP at 1.0575Ignored
DislikedGot stopped out at BE on this one.
This time I will stick with the trend.
Sell on the retest of the broken supportIgnored
DislikedFirst short try didn't work out well.
However, I am seeing a rising wedge forming.
Maybe this time it would work out.Ignored
DislikedThe daily USD/CHF chart shows that price is getting close to the downsloping yellow trend line.
Guess who will be shorting there bigtimeIgnored