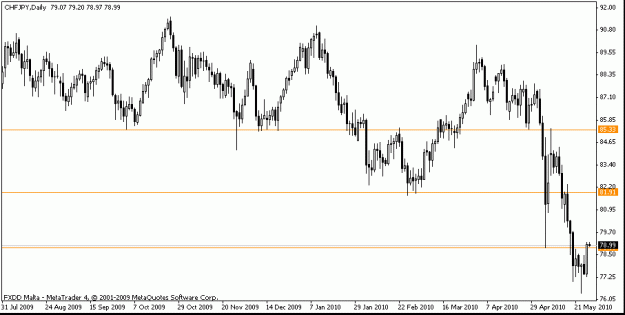
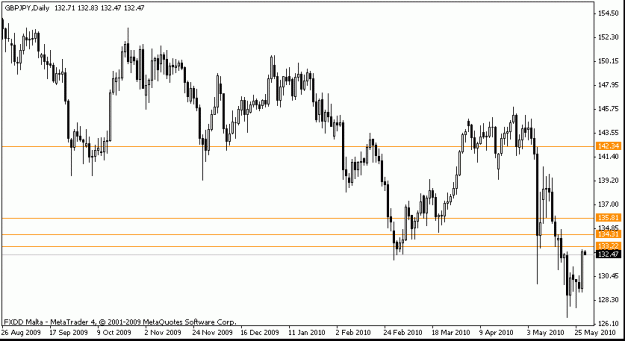
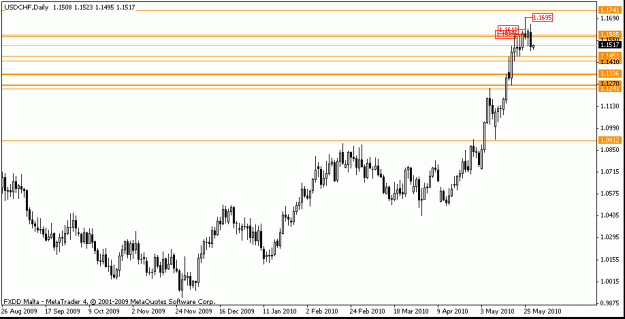
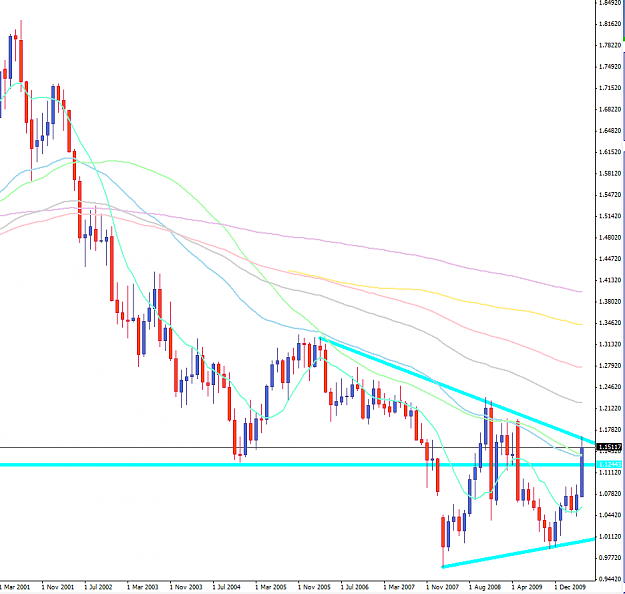
Something I wanted to touch on here. I am a constant lurker on here but mostly trade intraday. Not very often do I see monthly charts posted, and they can be a great help while dealing with the dailies. Someone brought up the daily pinbar on the USD/CHF from a few days ago. This was a trade I took.
There were some comments about it not being in a great location, and against the trend etc. All one would have had to do is bring up a monthly chart and see that in fact it was a decent location off the huge trend line and sellers came in hard at exactly this location. As for the trend, well yes on the daily the trend is up - but it's tough to look at the monthly chart and say that "Yes, the USD/CHF is in an uptrend" as it has been making lower highs for the last 10 years. Just something to think about.
Cheers
Edit: Also depending on what happens tomorrow, this has a chance of becoming a great weekly pinbar.
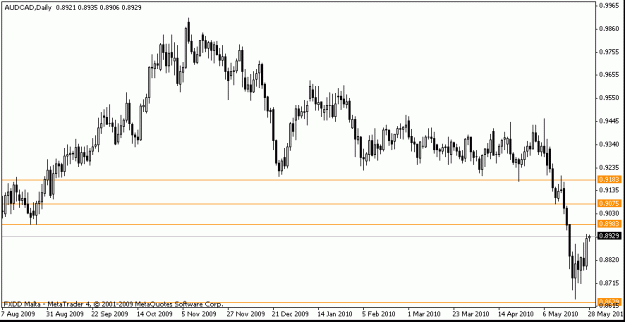
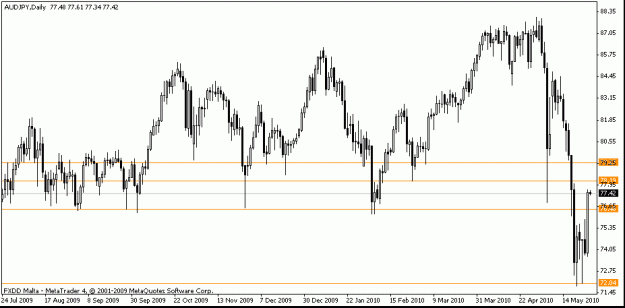
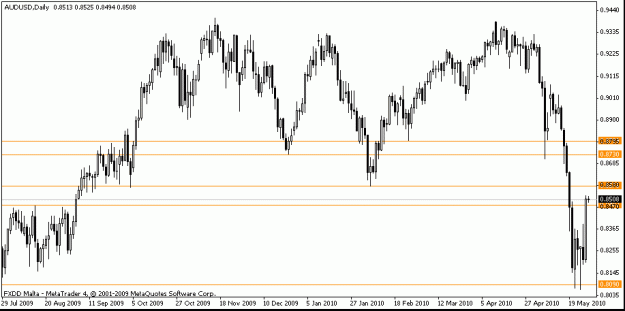
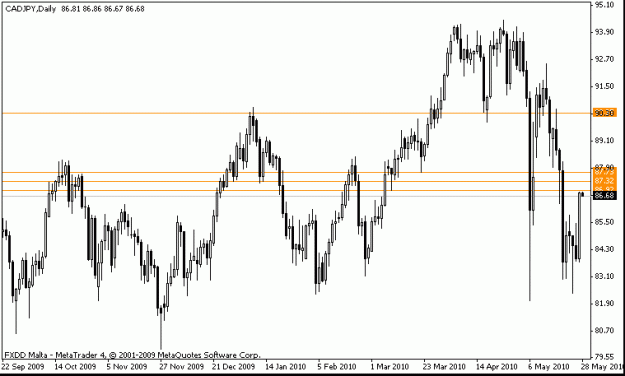
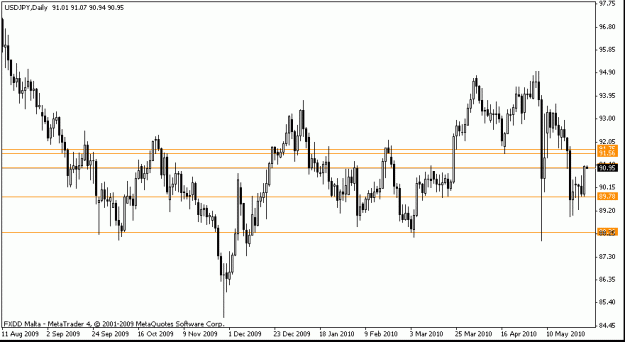
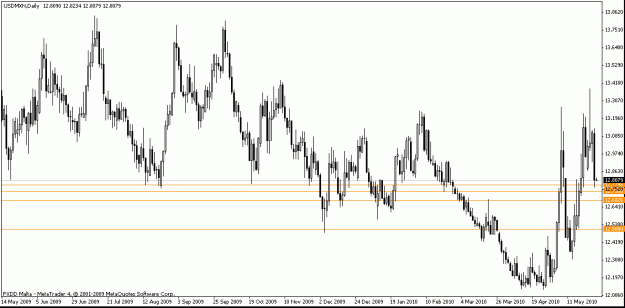
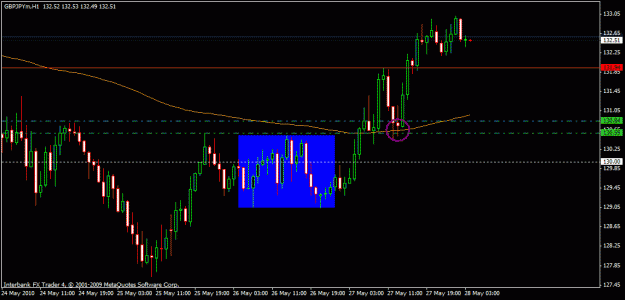
Attached Image (click to enlarge)
Cap