Hi there, as you know I dont know much about astrological sign, but technically speaking DJ might drop further, be careful and use SL.
Regarding your question, you can look at currency pairs that have higher correlation with S&P and DJ, like A/U ,U/Cad and their JPY crosses.
Ignored
Hi Shahab,
Thanks for that. I am long on DJ 4 lots averaging 9835. Exited my shorts on EU/US, and AU/US that I kept as hedge. It has worked ok so far. No TP yet, intend to keep for a ahile. Lets see.
Find a job that you love and you dont have to work again in your life.
U/Cad is playing with my feelings ,I took another short at 1.08250 ,Sl=1.0850 1st TP=1.0725 2nd TP=TBD
Ignored
I entered that one on the last retest of the 1.08 area but for a scalp only
Got in @ 1.0805 and cashed in on the bounce of 1.0725 area for a quick 75 pips.
Take what I get get until I see a clearer direction.
(note to myself: take 2 positions next time and only cash in one of them, second one SL>BE)
Ignored
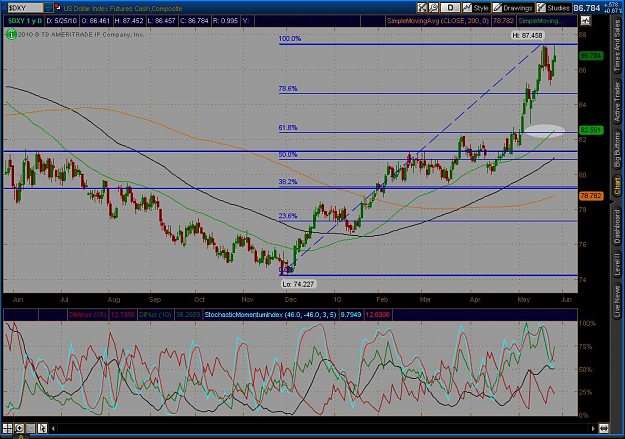
Sweet, the direction has become clear though, we are going for a retrace in USDX.