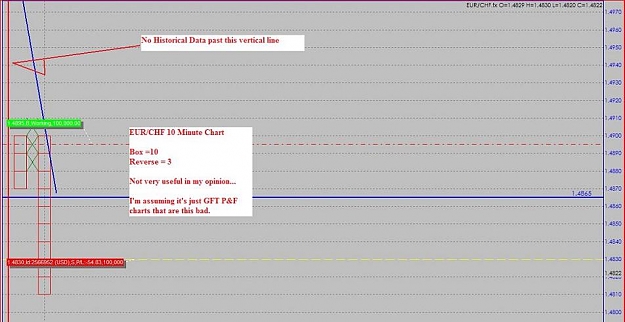
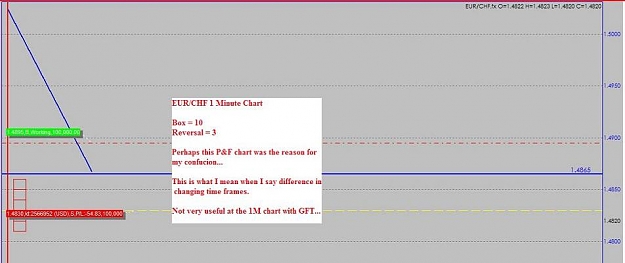
Dislikedhmm you seem to really be missing some key understandings... charts are bad representations of price action in that they obscure the data....Ignored
- #64
- Dec 31, 2009 5:33am Dec 31, 2009 5:33am
- Joined Oct 2009 | Status: . | 4,038 Posts
Congratulations ScalaFX for coming out of the closet!
- #67
- Dec 31, 2009 9:09pm Dec 31, 2009 9:09pm
- Joined Oct 2009 | Status: . | 4,038 Posts
Congratulations ScalaFX for coming out of the closet!
- #68
- Edited 9:54pm Dec 31, 2009 9:14pm | Edited 9:54pm
- Joined Oct 2009 | Status: . | 4,038 Posts
Congratulations ScalaFX for coming out of the closet!
- #69
- Dec 31, 2009 9:49pm Dec 31, 2009 9:49pm
- Joined Oct 2009 | Status: . | 4,038 Posts
Congratulations ScalaFX for coming out of the closet!
- #72
- May 23, 2010 6:46pm May 23, 2010 6:46pm
- Joined Oct 2009 | Status: . | 4,038 Posts
Congratulations ScalaFX for coming out of the closet!
- #74
- May 23, 2010 8:48pm May 23, 2010 8:48pm
- Joined Oct 2009 | Status: . | 4,038 Posts
Congratulations ScalaFX for coming out of the closet!
- #77
- Jun 7, 2010 6:04pm Jun 7, 2010 6:04pm
- Joined Oct 2009 | Status: . | 4,038 Posts
Congratulations ScalaFX for coming out of the closet!