hi fxripper, may i know how do u plot 2 different of kumo over the same chart?and also, does the dark green line act as Ks on h1 chart?
Ignored
hi. just place 2 ichimoku on the same chart. first with the original settings and the second one is to be multiplied. for example, if u trade o m15, u wanna have a cloud on H1. so u open a m15 chart, place the first ichimoku with original settings (9,26,52) and then place the second one with the setting multiplied by 4 because to build a H1 candle requires 4 M15 candles. so the settings would be (36,104,208).
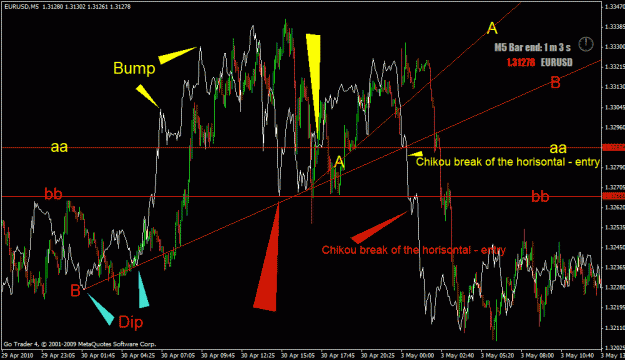
Originally Posted by Kinkohttp://cdn.forexfactory.com/images/buttons/viewpost.gif What I find helpful is to zoom out the chart and then draw trendlines at the dips and bumps of the Chikou. When the chikou then break those trendlines as well as the horizontal on the last Chikou bump(dip) its time to enter.
You can do the same with only the Chikou and price on the chart.
In effect you only need the Chikou or 1ma(-26) on the chart to be able to trade effectively.
Ignored
Hi Kinko,
Could you explain more about this? I don't understand where are the dips and bumps of the Chikou? and what is the last Chikou's horizontal?
Could you explain more about this? I don't understand where are the dips and bumps of the Chikou? and what is the last Chikou's horizontal?
Thanks in advanced..
Ignored
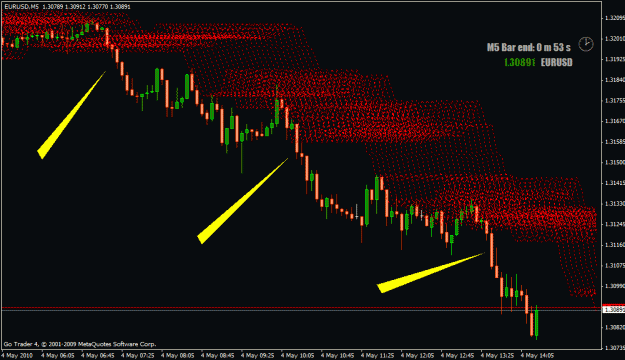
I have two trendlines in the image below
Red Trendline B-B with the horisontal bb-bb drawn at the previous low(dip) of the chikou - see the red arrow.
Entry point is where we have a chikou-bb-bb line cross
Yellow Trendline A-A with horisontal drawn at previous low(dip) of the chikou - see the yellow arrow.
Entry point where we have a chikou -aa-aa line cross.
The more you play around with it the easier it gets to spot the entry points.
I only have the chikou on the chart otherwise it becomes messy.
I have a 4hr trade that I have just opened literally this minute. I like it given the strong EUR bearish sentiment in the market. Both the EUR/CAD and GBP/CAD are setting up for this trade however if you check the EUR/GBP as a reference you can see that the EUR is the weaker of the two currencies so the EUR/CAD has a greater chance of further weakness.
See below for the logic and hope you get some green out of this one.
EURCAD,
SHORT @ 1.3330-1.3335
SL @ 1.3395 (10 pips above 1hr KS)
TP1: 1.3240 just above most recent swing low
TP2: 1.3000 trail SL above 4hr KS
Reason: 4hr kumo break has occurred and just waited for 1hr candle retest of weekly pivot area S1. Daily and weekly support trend. 4hr TS/KS cross has just occurred on previous 4hr candle.
R:R: 60 pips at risk: 95 pips initial target (335 pips in extension to TP2)
Relevant Info: Not a lot of support below here except weekly pivot support levels with next swing low around 1.2540 area.
Could you explain more about this? I don't understand where are the dips and bumps of the Chikou? and what is the last Chikou's horizontal?
Thanks in advanced..
Ignored
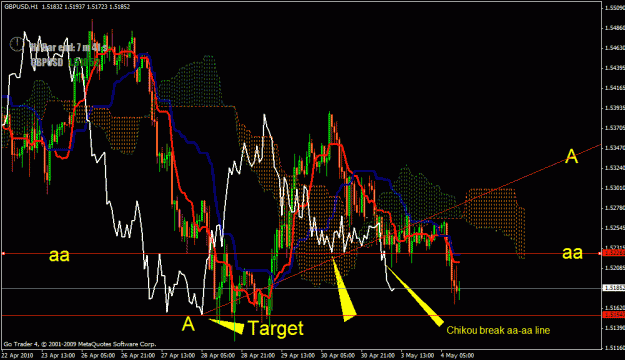
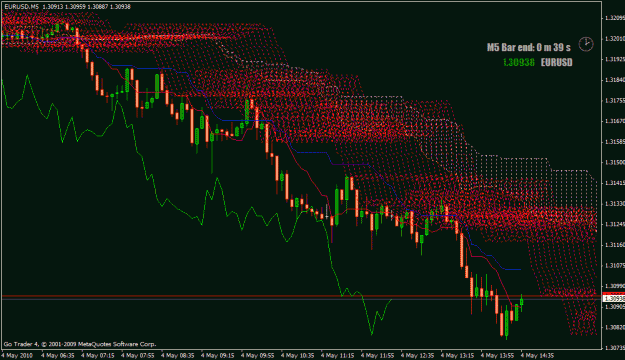
Same as previous - EURUSD H1
Trendline AA
Horisontal line aa-aa drawn at previous low of Chikou - see yellow arrow
Entry at chikou break of the aa-aa line
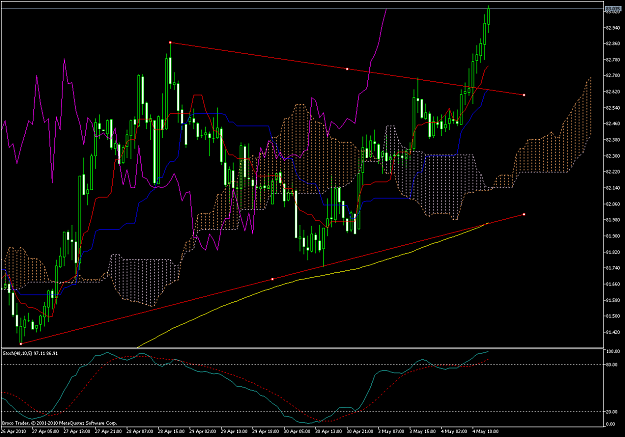
Drawing pitchforks requires accurate identification of previous and current swing highs and lows. By incorporating Itchy these become really obvious because you choose the last high or low before a move through the cloud to choose your pivots. It then gives you really high probability setups or areas where you can look for possible divergent candles in the future. Hope this helps you guys as much as it has helped me!!
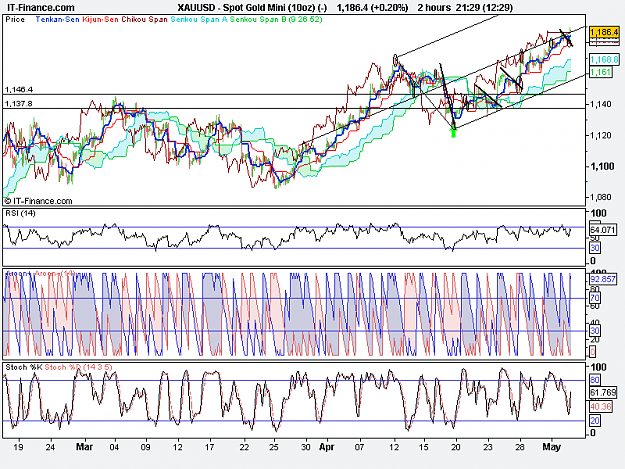
It's amazing how well (like Itchy) it can predict future price movement. Draw some pitchforks on a daily gold chart if you are in any doubt.
Could you please give another example showing where you place the horizontal line for an entry?
Thanks,
Herty
Ignored
To simplify the lot only draw the chikou but this time in the future from +14 to +40 (or the 1MA shift from +14 to +40)
This will create a cloud in front of the price
Enter when the price leaves the cloud - easy as that
To simplify the lot only draw the chikou but this time in the future from +14 to +40 (or the 1MA shift from +14 to +40)
This will create a cloud in front of the price
Enter when the price leaves the cloud - easy as that
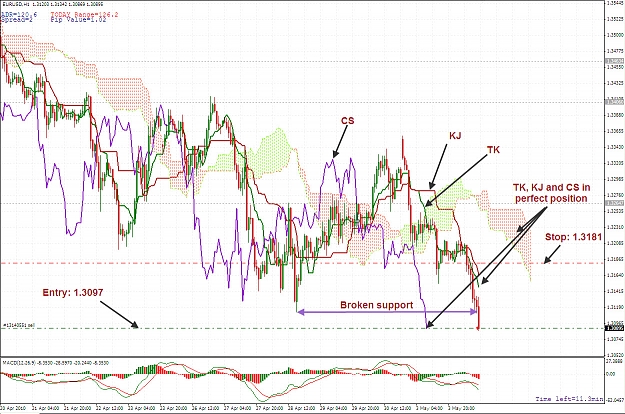
Hi Everyone.
Shorted 0.1 lot EURUSD at 1.30907 stop loss at 1.31817. entry time frame was H1.
if you want to grade this trade in ABC scale what would be this trade grade?
I think this is a B trade.
Comments are appreciated.
Same as previous - EURUSD H1
Trendline AA
Horisontal line aa-aa drawn at previous low of Chikou - see yellow arrow
Entry at chikou break of the aa-aa line
Target level at A
Ignored
Wow... that was really clear.. thanks to explain it in detail.. and thanks so much to share your method with us here.. many green pips for you..!
Hi Everyone.
Shorted 0.1 lot EURUSD at 1.30907 stop loss at 1.31817. entry time frame was H1.
if you want to grade this trade in ABC scale what would be this trade grade?
I think this is a B trade.
Comments are appreciated.
Ignored
I agree. I jumped after a break and close below the resistance at 13085. TP1 13035 - 50 pips
|
Joined Apr 2006
|
Status: MB Trading
|2,112 Posts
EURUSD - Shot Down by the Kumo, 1.3000 in its sights GBPUSD - Killed by the 20ema AUDUSD - You like watching paint dry? USDCAD - Attempting a base but can we trust? USDJPY - Is it for real? Above the Kumo? Full Report Available here from Chris Capre