I closed them all, this time of day is risky, we saw the retracement, it may go up again, I dont like it after all happened
Ignored
i set a tp of 13 pips just above support and tightened the stop to ten pips just above the high and went to bed ( it was 3 am here in aust.) i got my pips
hi there, I looked what you posted, I couldn't get a clue, what is it about?
Ignored
hey shah.... awhile back patience mentioned a pair had already done it's average atr for the week, or something similar.... i mentioned some sort of indicator showing the atr's might be nice, or something similar.....
//-----
it's still unfinished, work on it in my limited free time.....
there are 7 indicators with names and timeframes shown in the rows....
such as, macd 15 is fifteen minute macd and so on..... the large triangle shows direction of last closed bar.... smaller triangle to left is the direction of the prior bar to it.... and small triangle to the right is the direction of the current unfinished bar.....
to the far right are the atr's labeled by timeframes.... the background is blue and sectioned by percents.... 100,200,300....... the red bars are the current progress in each of the timeframes.... so if the pair had moved 100% of it's atr in a particular timeframe, the red bars in that timeframe would be at the 100% magenta line....
the red value below each bar is the average atr of the timeframe and the blue value below it is the current pips progress of the timeframe.....
below that are your closed trades per symbol for the year and below that is the profitable trades for that symbol....
//----
the signal at the top is just an unfinished buy/sell/wait type ..... you buy at 21 and sell at -21.... or a like value....
there's a lot more to it, most can not be seen all at the same time.... such as pivot values, distances to s/r , major upper/lower trend channels and so on....... you must select what your interested in.......
it's all user selectable and can be on any chart and still give the results for any selected pair......
still unfinished......h
Attached Image(s) (click to enlarge)
to trade and code, keep both simple... no call to impress....h
If you get a chance could you please let us know:
1. Do you plot both Daily & Weekly S/R's on your graphs?...
Ignored
If you get a chance could you please let us know:
1. Do you plot both Daily & Weekly S/R's on your graphs? If any other S/R, which ones and how do you obtain them?
I use daily and weekly, I have two separate indicators for them which take care of the pivots and S/R. if you don't have them I can share them here.
I draw other R/S line by looking at the chart, but the most important one, which I use are the S turned R and visa versa
2. Do you utilize any MA's on your charts? Any specific to the TF you are trading?
Only a 55ema ,and I use it as S/R level to set my entry mostly on 4Hr
4Hr is the key , but I look at daily and weekly and Hr too.
3. What is your favorite TF to trade off of?
Hr/ 30min
4. How many pips away from the S/R do you often set your pending orders at?
It depends on the type of S/R - is it weekly/daily? or previous S/R or a S>R ,R>S.
for daily pivot S/R precisely on the level
for weekly pivot S/R 5-10 pips before them
for previous S/R wait to see the PA
for S>R, R>S precisely at the level.
5. What typical size SL do you use?
It depends on lots of factor, the pair ,the market volatility, my entry level.
as a general rule, 30-40 for commodity currencies and JPY ,Eur,CHF
for Cable 40-50 ,for E/J 40-50 ,G/J 60-70 for Gold 100.
but they may vary according to lots of other factors.
6. Do you have a specific number of pips that you try to target on each trade or do you shoot for the next S/R in the direction of your trade?
It depends on the type of trade, one touch usually TP a bit more than my SL (RRR 1:1.5/2)
for position/swing trades RRR 1:1 for the first position and then move SL>B/E for the 2nd position and targeting a significant S/R
G'day Shahab - thought I'd throw my bits out there. SSI is showing open interest below it's monthly average on all pairs but Cable. Do you think traders are getting tired of being whipsawed?
SSI: NZDUSD Ratio Pushes Lower Following 24% Drop in Retail Interest
Friday, 09 Apr 2010 20:29 GMT
Written by David Song, Currency Analyst
Attached Image (click to enlarge)
Intraday Highlight:
NZDUSD - The ratio of long to short positions in the NZDUSD stands at -1.40 as nearly 58% of traders are short. Yesterday, the ratio was at -1.11 as 53% of open positions were short. In detail, long positions are 24.3% lower than yesterday and 20.3% weaker since last week. Short positions are 4.9% lower than yesterday and 5.9% stronger since last week. Open interest is 14.1% weaker than yesterday and 13.9% below its monthly average. The SSI is a contrarian indicator and signals more NZDUSD gains.
SSI Details:
EURUSD - The ratio of long to short positions in the EURUSD stands at -1.28 as nearly 56% of traders are short. Yesterday, the ratio was at 1.06 as 52% of open positions were long. In detail, long positions are 21.2% lower than yesterday and 9.7% weaker since last week. Short positions are 7.0% higher than yesterday and 6.4% weaker since last week. Open interest is 7.5% weaker than yesterday and 8.6% below its monthly average. The SSI is a contrarian indicator and signals more EURUSD gains.
GBPUSD - The ratio of long to short positions in the GBPUSD stands at -1.58 as nearly 61% of traders are short. Yesterday, the ratio was at -1.58 as 61% of open positions were short. In detail, long positions are 10.1% lower than yesterday and 2.6% weaker since last week. Short positions are 10.0% lower than yesterday and 22.0% stronger since last week. Open interest is 10.0% weaker than yesterday and 4.1% above its monthly average. The SSI is a contrarian indicator and signals more GBPUSD gains.
GBPJPY - The ratio of long to short positions in the GBPJPY stands at -1.22 as nearly 55% of traders are short. Yesterday, the ratio was at -1.02 as 50% of open positions were short. In detail, long positions are 11.6% lower than yesterday and 14.2% stronger since last week. Short positions are 5.7% higher than yesterday and 14.7% weaker since last week. Open interest is 2.9% weaker than yesterday and 7.2% below its monthly average. The SSI is a contrarian indicator and signals more GBPJPY gains.
USDJPY - The ratio of long to short positions in the USDJPY stands at 1.59 as nearly 61% of traders are long. Yesterday, the ratio was at 1.38 as 58% of open positions were long. In detail, long positions are 2.0% higher than yesterday and 52.0% stronger since last week. Short positions are 11.3% lower than yesterday and 40.0% weaker since last week. Open interest is 3.6% weaker than yesterday and 0.4% below its monthly average. The SSI is a contrarian indicator and signals more USDJPY losses.
USDCAD - The ratio of long to short positions in the USDCAD stands at 3.27 as nearly 77% of traders are long. Yesterday, the ratio was at 3.81 as 79% of open positions were long. In detail, long positions are 12.5% lower than yesterday and 2.4% weaker since last week. Short positions are 1.9% higher than yesterday and 1.9% stronger since last week. Open interest is 9.5% weaker than yesterday and 4.4% below its monthly average. The SSI is a contrarian indicator and signals more USDCAD losses.
USDCHF - The ratio of long to short positions in the USDCHF stands at 1.39 as nearly 58% of traders are long. Yesterday, the ratio was at 1.33 as 57% of open positions were long. In detail, long positions are 9.6% lower than yesterday and 13.6% weaker since last week. Short positions are 13.2% lower than yesterday and 26.4% stronger since last week. Open interest is 11.1% weaker than yesterday and 37.4% below its monthly average. The SSI is a contrarian indicator and signals more USDCHF losses.
AUDUSD - The ratio of long to short positions in the AUDUSD stands at -1.88 as nearly 65% of traders are short. Yesterday, the ratio was at -1.65 as 62% of open positions were short. In detail, long positions are 16.5% lower than yesterday and 5.0% weaker since last week. Short positions are 4.7% lower than yesterday and 7.7% stronger since last week. Open interest is 9.2% weaker than yesterday and 1.2% below its monthly average. The SSI is a contrarian indicator and signals more AUDUSD gains.
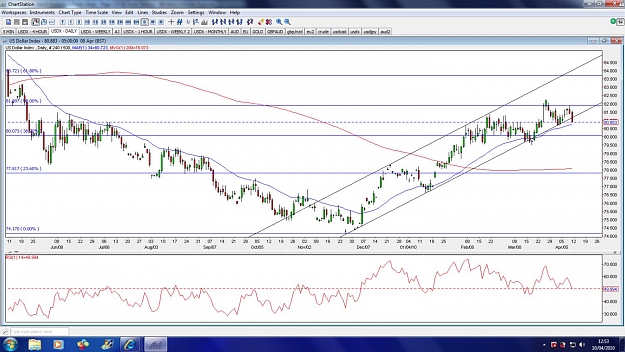
USDX 4 Hour, Daily and Weekly
I'm not sure what to make of it. 4 hour is nearing 200 MA again so could be good for a bounce. Daily has closed outside of my trendline and I don't know what to make of that weekly candle. Any candlestick experts out there want to give an opinion?
G'day Shahab - thought I'd throw my bits out there. SSI is showing open interest below it's monthly average on all pairs but Cable. Do you think traders are getting tired of being whipsawed?
SSI: NZDUSD Ratio Pushes Lower Following 24% Drop in Retail Interest
Friday, 09 Apr 2010 20:29 GMT
Written by David Song, Currency Analyst
NZDUSD - The ratio of long to short positions in the NZDUSD stands at -1.40 as nearly 58% of traders are short. Yesterday,...
Ignored
G'day patience, thanx for posting SSI, I thought you got tired of posting it.
I think all the SSI's are indicating the right direction of the market ,I'm just skeptical of U/Cad, to me it has bottomed or it's bottoming.
I think we will see more correction in USDX (the weekly candlestick is bearish to me, it is a "Gravestone Doji", 51% of time bearish reversal )but that will be before the next leg up for USDX
hey shah.... awhile back patience mentioned a pair had already done it's average atr for the week, or something similar.... i mentioned some sort of indicator showing the atr's might be nice, or something similar.....
Ignored
The Patience Meter Cool. Might take me a few weeks to get my head around it. Does it come with user friendly instructions? I'm a bit slow on the uptake at times
hey shah.... awhile back patience mentioned a pair had already done it's average atr for the week, or something similar.... i mentioned some sort of indicator showing the atr's might be nice, or something similar.....
//-----
it's still unfinished, work on it in my limited free time.....
there are 7 indicators with names and timeframes shown in the rows....
such as, macd 15 is fifteen minute macd and so on..... the large triangle shows direction of last closed bar.... smaller triangle to left is the direction of the prior bar to it.......
Ignored
thanx for explanation, I think I should try your EA's they seem practical.
G'day patience, thanx for posting SSI, I thought you got tired of posting it.
I think all the SSI's are indicating the right direction of the market ,I'm just skeptical of U/Cad, to me it has bottomed or it's bottoming.
I think we will see more correction in USDX, but that will be before the next leg up for USDX
Ignored
No, I don't mind at all to post it when I'm around. It doesn't take long to do. I was thinking the USDX charts were saying more downside for US$ so it's good to have your confirmation. I just said last week that I thought we needed more of a commitment from the Fed with interest rates before we would see more upside for US$, so I don't know why I'm trying to confuse myself.
As for the Loonie, traders aren't adding to their long positions. I know Coolshades has asked for interpretations of SSI a couple of times. Well to me that indicates that most of the traders long on this pair were long before it broke support and/or they were long before 1.02XX so they are holding out for higher prices and are too scared to add to their positions because they don't know if it is going to break parity with force. So even though the positioning indicates more losses, it won't always necessarily mean this because the bulk of traders were long from higher levels. I look into the detail of the currencies that I am trading rather than just looking at the positioning graph - if you get what I mean.
No, I don't mind at all to post it when I'm around. It doesn't take long to do. I was thinking the USDX charts were saying more downside for US$ so it's good to have your confirmation. I just said last week that I thought we needed more of a commitment from the Fed with interest rates before we would see more upside for US$, so I don't know why I'm trying to confuse myself.
Ignored
I edited my post , the weekly candlestick is a "Gravestone Doji", theoretically it is a bearish reversal, statistically 51% of times bearish reversal occurs
I edited my post , the weekly candlestick is a "Gravestone Doji", theoretically it is a bearish reversal, statistically 51% of times bearish reversal occurs
Ignored
Yeah, I thought it was but because the previous weekly candle was bearish as well it didn't agree with the explanation. It would have been more clear (to me at least) if we had had a bullish weekly candle the previous week.
No, I don't mind at all to post it when I'm around. It doesn't take long to do. I was thinking the USDX charts were saying more downside for US$ so it's good to have your confirmation. I just said last week that I thought we needed more of a commitment from the Fed with interest rates before we would see more upside for US$, so I don't know why I'm trying to confuse myself.
As for the Loonie, traders aren't adding to their long positions. I know Coolshades has asked for interpretations of SSI a couple of times. Well to me that indicates that most...
Ignored
you were quite right last week, things were pointing at USD weakness after FOMC statement.
on a separate note, I posted this G/U monthly at the end of March in DT thread.it's good to look at monthly chart once in a while.
you were quite right last week, things were pointing at USD weakness after FOMC statement.
on a separate note, I posted this G/U monthly at the end of March in DT thread.it's good to look at monthly chart once in a while.
Ignored
You are right. You know I don't trade this pair very often (maybe a few times a year) because it smacks me most of the time but GodfreyH's Jurik indicator indicated to me that Cable was going to make gains. I've attached 4 hour, daily, weekly and monthly. You can see that 4 hour and daily were green and weekly has also turned. Monthly still looks a bit dire though. Everyone was trying to short it though and because I don't follow Cable enough to give an informed opinion, I thought I'd wait to see how it played out.
And here's an article on the effect of a Yuan revaluation. Bloomberg were also saying that if the Yuan was revalued, the AUD would most likely benefit.